what is the ROA, ROE, Profit margin, ROI, Return of capital employed
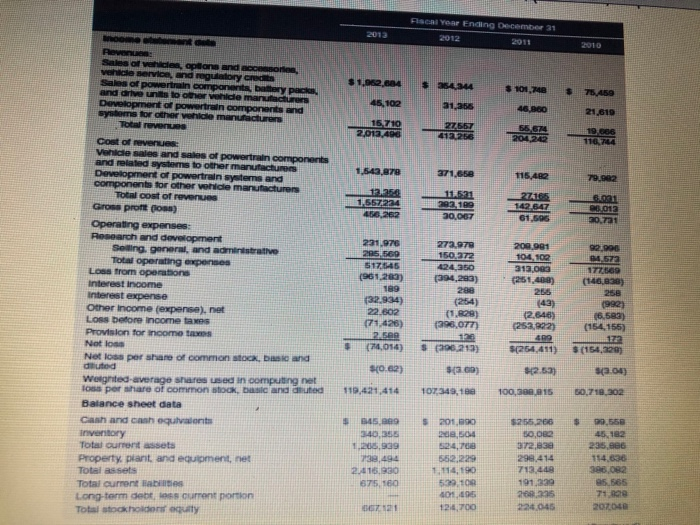
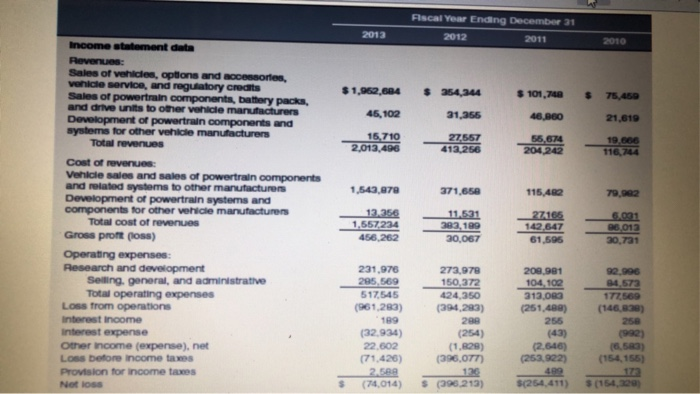
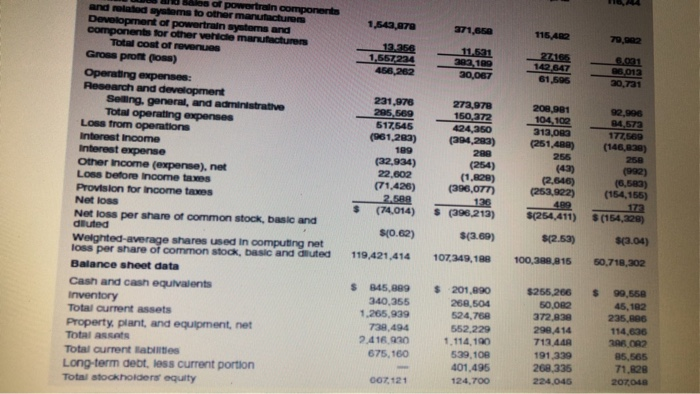
Fiscal Year Ending December 31 2011 2013 2010 $1.052.864 $ 2544 $ 101,748 $ 75,459 45,102 31.855 46.000 21.610 16 710 2.012.40 127,567 1926 55 674 2012 19 006 116.74 1.543.879 271,650 115.482 79.982 12250 1 557224 456,262 11.521 293 189 30.087 276165 142.847 61.595 0.012 30.7a1 Sales of vehicles options and comes de service, and regulatory credits Sales of powertrain components, battery packs, and drive units to other vehide manufacturers Development of powertrain components and systems for other vehicle man nacturers Total revenues Cost of revenues Vehicle sales and sales of powertrain components and related systems to other manufacturers Development of powertrain systems and components for other vehicle manufacturer Total cost of revenues Gross proft Operating expenses: Research and development Seling, general, and administrative Total operating expenses LOS from operations Interest income Interest expense Other Income (expense), net Loss before income taxes Provision for income taxes Not loss Net loss per share of common stock, and diluted Wegrited average shares used in computing net los per share of common stock, bland autod Balance sheet data Cash and cash equivalent Inventory Total current sets Property, plant, and equipment, net Total assets Total current tables Long-term debt less current portion Tots stockholders quity 231.976 285 569 517145 (961.200) 189 32.934) 22.602 (71.426) 2509 (74,014) 20.991 104,100 312.09 (251,400) 255 272.97 150272 424.350 (394.293) 288 (254) (1.828 396,077) 126 $ 396.213) 92.990 4572 177569 (146,838) 258 (992) 16.583) (154,155) (2.846) (252.822) $(254, 411) $(154,320) SO62) $a en $12.53) Sa 04) 119,421,414 107.349,18 100,30915 50,710.302 $ 99,558 S459 340,35 1,205,989 738,494 2.415.930 675 180 $ 201,00 we, 524,75 552.229 1.114,190 509,109 401005 124,700 $255.266 50,00 372,63 298,414 713448 191.239 200335 4045 235,866 114.836 398,082 95.565 71 000 207.04 121 Fiscal Year Ending December 31 2012 2011 2013 $1.952,804 $ 354,244 $ 101,740 $ 75,450 45,102 31.356 46.BGO 21.619 15.710 2,013,496 27,557 412,256 55,674 204.242 19.666 116,744 1,549.97 371,650 115.482 79,902 Income statement data Revenues Sales of vehicles, options and accessories, vehicle service, and regulatory Credits Sales of powertrain components, battery packa, and drive units to other vehicle manufacturers Development of powertrain components and systems for other vehicle manufacturers Total revenues Cost of revenues: Vehicle sales and sales of powertrain components and related systems to other manufacturers Development of powertrain systems and components for other vehicle manufacturers Total cost of revenues Gross proft (los) Operating expenses: Research and development Selling, general, and administrative Total operating expenses Loss from operations Interest income Interest expense Other Income (expense), net Loss before income taxes Provision for income taxes Not loss 13.356 1.557234 456,262 11.531 382, 189 30,067 27165 142.647 61,595 5.031 26.013 30.731 231.976 285,569 517,545 (961,283) 189 (32.934) 22.602 (71.420) 25 (74,014) 273,970 150,372 424.350 (394,283) 299 (254) (1,828) (396,07T) 126 $ (396 213) 209.981 104,100 313,089 (251,489) 255 (43) (2.646) (253,922) 92.996 B4.572 177569 (146,830) 250 (992) (6,583) (154,155) $(254,411) 1,543,870 271,650 115,482 79,002 13.356 1,557224 456,262 11.521 202 189 20,067 27.165 142.547 61,505 06.013 20,7a1 les of powertrain components and related systems to other manufacturers Development of powertrain systems and components for other vehicle manufacturers Total cost of revenues Gross propos) Operating expenses: Research and development Selling, general, and administrative Total operating expenses Loss from operations Interest Income Interest expense Other Income (expense), net LOSS before income taxes Provision for income taxes Net loss Net loss per share of common stock, basic and diluted Weighted average shares used in computing net loss per share of common stock, basic and olluted Balance sheet data Cash and cash equivalents Inventory Total current assets Property, plant, and equipment, net Total as Total current Habits Long-term debt, less current portion Total stockholders equity 231,976 295.569 517545 (961,283) 189 (32.934) 22.602 (71.426) 2.589 (74,014) 272,978 150.372 424,850 (294,289) 289 (254) (1.828) (396,077 136 $ (396.213) 208.981 104,102 313,089 (251.4) 255 (43) (2.646) (253,922) 489 $(254,411) 92.996 B4.572 177.569 (146,830) 250 (992) (6,580) (154,155) (154,229) ${0.62) $(3.69) $(2.53) $(3.04) 119.421,414 107,349,188 100.388.815 50,718,202 $ $ 45,889 340.355 1.265,939 739.494 2416 920 675,160 $ 201,690 266,504 524,750 552,229 1.114,190 539,108 401,495 124,700 $255.266 50.082 372.83 298,414 71244 191,339 268,335 224.045 99,550 45,182 235.896 114,636 26 OR? 85,565 71.828 207010 007, 121


