What is the Terminal Value based on the average of:
1) The terminal value based on a perpetual growth rate, and;
2) The terminal value based on the EBITDA exit multiple assumption outlined on the "Control Panel" tab
$599,446
$454,756
$400,206
$450,323
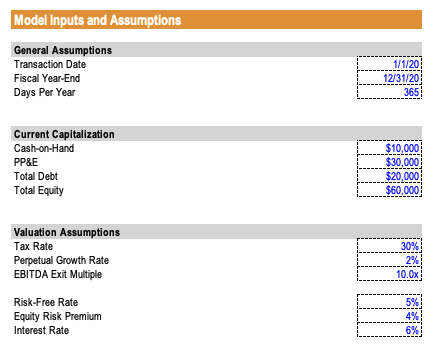
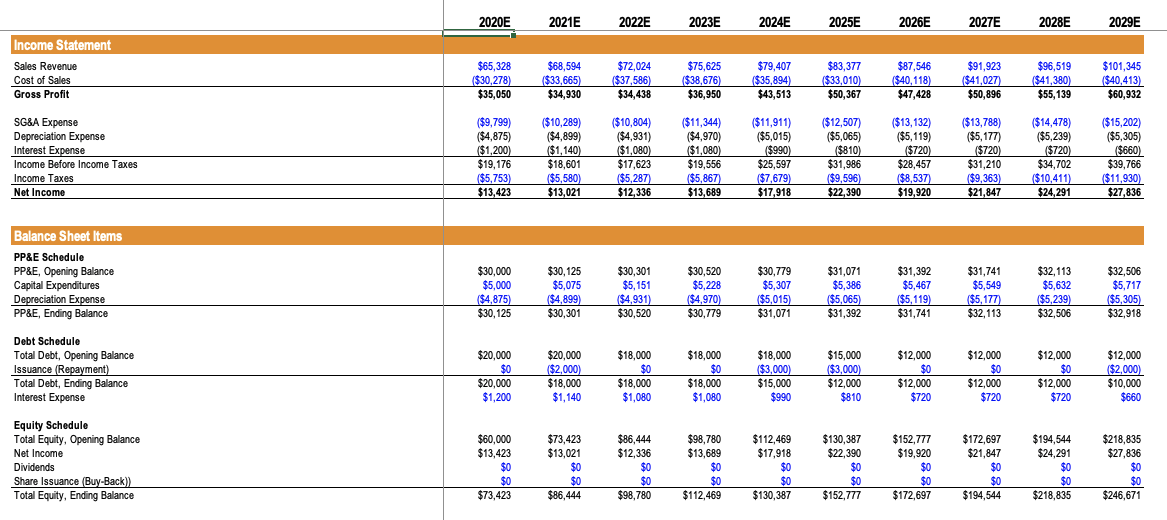
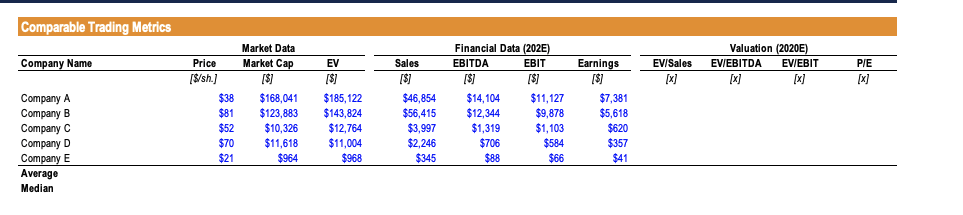
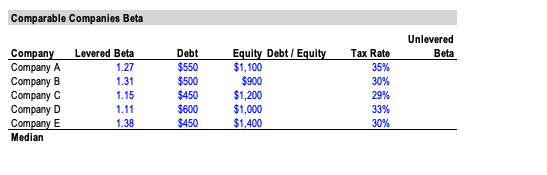
Model Inputs and Assumptions General Assumptions Transaction Date Fiscal Year-End Days Per Year 1/1/20 12/31/20 365 Current Capitalization Cash-on-Hand PP&E Total Debt Total Equity $10,000 $30,000 $20,000 $60,000 Valuation Assumptions Tax Rate Perpetual Growth Rate EBITDA Exit Multiple 30% 2% 10.0x Risk-Free Rate Equity Risk Premium Interest Rate 5% 4% 6% 2020E 2021E 2022E 2023E 2024E 2025E 2026E 2027E 2028E 2029E Income Statement Sales Revenue Cost of Sales Gross Profit $65,328 ($30,278) $35,050 $ $68,594 ($33,665 $34,930 $72,024 ($37,586) $34,438 $75,625 ($38,676) $36,950 $79,407 ($35,894) $43,513 $83,377 ($33,010) $50,367 $87,546 ($40,118) $47,428 $91,923 ($41,027) $50,896 $96,519 $41,380) $55,139 $101,345 ($40,413) $60,932 SG&A Expense Depreciation Expense Interest Expense Income Before Income Taxes Income Taxes Net Income ($9,799) ($4,875) ($1,200) $19,176 ($5,753) ($10,289) ($4,899) ($1,140 $18,601 ($5,580) $13,021 ($10,804) ($4,931) ($1,080) $17,623 ($5,287) ($11,344) ($4,970) ($1,080) $19,556 ($5,867) $13,689 ($11,911) ($ ($5,015) ($990) $25,597 ($7,679) ($12,507) ($5,065) ($810) $31,986 ($9,596) $22,390 ($13,132) ($5,119) ($720) $28,457 ($8,537) $19,920 ($13,788) ($5,177) ($720) $31,210 ($9,363) $21,847 ($14,478) ($5,239) $720 $34,702 ($10,411) $24,291 ($15,202) ($5,305) ($660) $39,766 ($11,930) $27,836 $13,423 $12,336 $17,918 Balance Sheet Items PP&E Schedule PP&E, Opening Balance Capital Expenditures Depreciation Expense PP&E, Ending Balance $30,000 $5,000 ($4,875) $30,125 $30,125 $5,075 ($4,899) $30,301 $30,301 $5,151 ($4,931) $30,520 $30,520 $5,228 ($4,970) $30,779 $30,779 $5,307 ($5,015) $31,071 $31,071 $5,386 ($5,065) $31,392 $31,392 $5,467 $5,119) $31,741 $31,741 $5,549 ($5,177) $32,113 $32,113 $5,632 ($5,239) $32,506 $32,506 $5,717 ($5,305) $32,918 Debt Schedule Total Debt, Opening Balance Issuance (Repayment) Total Debt, Ending Balance Interest Expense $20,000 $0 $20,000 $1,200 $20,000 ($2,000) $18,000 $1,140 $18,000 $0 $18,000 $1,080 $18,000 $0 $18,000 $1,080 $18,000 $3,000) $15,000 $990 $15,000 $3,000) $12,000 $810 $12,000 $0 $12,000 $720 $12,000 $0 $12,000 $720 $12,000 $0 $12,000 $720 $12,000 ($2,000) $10,000 $660 Equity Schedule Total Equity, Opening Balance Net Income Dividends Share Issuance (Buy-Back)) Total Equity, Ending Balance $60,000 $13,423 $0 $0 $73,423 $73,423 $13,021 $0 $0 $86,444 $86,444 $12,336 $0 $0 $98,780 $98,780 $13,689 $0 $0 $112,469 $112,469 $17,918 $0 $0 $130,387 $130,387 $22,390 $0 $0 $152,777 $152,777 $19,920 $0 $0 $172,697 $172,697 $21,847 $0 $0 $194,544 $194,544 $24.291 $0 $0 $218,835 $218,835 $27,836 $0 $0 $246,671 Comparable Trading Metrics Company Name Earnings EV [$] PIE Valuation (2020E) EV/EBITDA EV/EBIT [x] [x] EV/Sales [x] Company A Company B Company C Company D Company E Average Median Price [$/sh.) $38 $81 $52 $70 $21 Market Data Market Cap [$] $168,041 $123,883 $10,326 $11,618 $964 $185,122 $143,824 $12,764 $11,004 $968 Sales [$] $46,854 $56,415 $3,997 $2,246 $345 Financial Data (202E) EBITDA EBIT [$] [$] $14, 104 $11,127 $12,344 $9,878 $1,319 $1,103 $706 $584 $88 $66 [$] $7,381 $5,618 $620 $357 $41 Comparable Companies Beta Unlevered Beta Tax Rate 35% 30% Company Company A Company B Company C Company D Company E Median Levered Beta 1.27 1.31 1.15 1.11 1.38 Debt $550 $500 $450 $600 $450 Equity Debt / Equity $1,100 $900 $1,200 $1,000 $1,400 29% 33% 30% Model Inputs and Assumptions General Assumptions Transaction Date Fiscal Year-End Days Per Year 1/1/20 12/31/20 365 Current Capitalization Cash-on-Hand PP&E Total Debt Total Equity $10,000 $30,000 $20,000 $60,000 Valuation Assumptions Tax Rate Perpetual Growth Rate EBITDA Exit Multiple 30% 2% 10.0x Risk-Free Rate Equity Risk Premium Interest Rate 5% 4% 6% 2020E 2021E 2022E 2023E 2024E 2025E 2026E 2027E 2028E 2029E Income Statement Sales Revenue Cost of Sales Gross Profit $65,328 ($30,278) $35,050 $ $68,594 ($33,665 $34,930 $72,024 ($37,586) $34,438 $75,625 ($38,676) $36,950 $79,407 ($35,894) $43,513 $83,377 ($33,010) $50,367 $87,546 ($40,118) $47,428 $91,923 ($41,027) $50,896 $96,519 $41,380) $55,139 $101,345 ($40,413) $60,932 SG&A Expense Depreciation Expense Interest Expense Income Before Income Taxes Income Taxes Net Income ($9,799) ($4,875) ($1,200) $19,176 ($5,753) ($10,289) ($4,899) ($1,140 $18,601 ($5,580) $13,021 ($10,804) ($4,931) ($1,080) $17,623 ($5,287) ($11,344) ($4,970) ($1,080) $19,556 ($5,867) $13,689 ($11,911) ($ ($5,015) ($990) $25,597 ($7,679) ($12,507) ($5,065) ($810) $31,986 ($9,596) $22,390 ($13,132) ($5,119) ($720) $28,457 ($8,537) $19,920 ($13,788) ($5,177) ($720) $31,210 ($9,363) $21,847 ($14,478) ($5,239) $720 $34,702 ($10,411) $24,291 ($15,202) ($5,305) ($660) $39,766 ($11,930) $27,836 $13,423 $12,336 $17,918 Balance Sheet Items PP&E Schedule PP&E, Opening Balance Capital Expenditures Depreciation Expense PP&E, Ending Balance $30,000 $5,000 ($4,875) $30,125 $30,125 $5,075 ($4,899) $30,301 $30,301 $5,151 ($4,931) $30,520 $30,520 $5,228 ($4,970) $30,779 $30,779 $5,307 ($5,015) $31,071 $31,071 $5,386 ($5,065) $31,392 $31,392 $5,467 $5,119) $31,741 $31,741 $5,549 ($5,177) $32,113 $32,113 $5,632 ($5,239) $32,506 $32,506 $5,717 ($5,305) $32,918 Debt Schedule Total Debt, Opening Balance Issuance (Repayment) Total Debt, Ending Balance Interest Expense $20,000 $0 $20,000 $1,200 $20,000 ($2,000) $18,000 $1,140 $18,000 $0 $18,000 $1,080 $18,000 $0 $18,000 $1,080 $18,000 $3,000) $15,000 $990 $15,000 $3,000) $12,000 $810 $12,000 $0 $12,000 $720 $12,000 $0 $12,000 $720 $12,000 $0 $12,000 $720 $12,000 ($2,000) $10,000 $660 Equity Schedule Total Equity, Opening Balance Net Income Dividends Share Issuance (Buy-Back)) Total Equity, Ending Balance $60,000 $13,423 $0 $0 $73,423 $73,423 $13,021 $0 $0 $86,444 $86,444 $12,336 $0 $0 $98,780 $98,780 $13,689 $0 $0 $112,469 $112,469 $17,918 $0 $0 $130,387 $130,387 $22,390 $0 $0 $152,777 $152,777 $19,920 $0 $0 $172,697 $172,697 $21,847 $0 $0 $194,544 $194,544 $24.291 $0 $0 $218,835 $218,835 $27,836 $0 $0 $246,671 Comparable Trading Metrics Company Name Earnings EV [$] PIE Valuation (2020E) EV/EBITDA EV/EBIT [x] [x] EV/Sales [x] Company A Company B Company C Company D Company E Average Median Price [$/sh.) $38 $81 $52 $70 $21 Market Data Market Cap [$] $168,041 $123,883 $10,326 $11,618 $964 $185,122 $143,824 $12,764 $11,004 $968 Sales [$] $46,854 $56,415 $3,997 $2,246 $345 Financial Data (202E) EBITDA EBIT [$] [$] $14, 104 $11,127 $12,344 $9,878 $1,319 $1,103 $706 $584 $88 $66 [$] $7,381 $5,618 $620 $357 $41 Comparable Companies Beta Unlevered Beta Tax Rate 35% 30% Company Company A Company B Company C Company D Company E Median Levered Beta 1.27 1.31 1.15 1.11 1.38 Debt $550 $500 $450 $600 $450 Equity Debt / Equity $1,100 $900 $1,200 $1,000 $1,400 29% 33% 30%