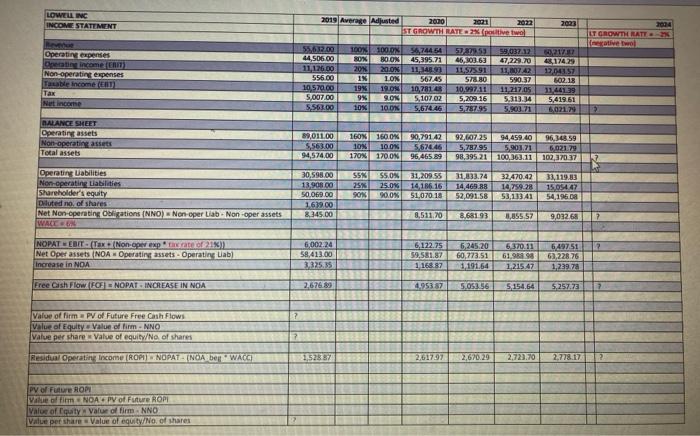
What is the value of the firm using the Free Cash Flow model for Lowell Inc.? Lowell Inc.pdf OOOO 1.87,104,80 O 2.88,827 32 3. 93,230.72 None of the options provided 4. 84,876.92 5. LOWELL INC INCOME STATEMENT 2003 2019 Averro Adjusted 2020 2021 2022 ST GROWTH RATE 2 (palive to 2004 LT GROWTH RATT Operating expenses Derating income (CAM) Non operating expenses Table Income ( Tax Net income 5567.00 44,506,00 11,176.00 556.00 10 570.00 5.007.00 5563.00 100X ON 20N IN 19 9% 100 UN 80.ON 20.ON I ON 19 ON SOK 10.DK 54,744 64 45,395.71 11. JA 567.45 10,281 5,107.02 5.67446 5787353 46,301.63 11,5591 578 80 10.992.11 5,209.16 5282.95 59,03717 47,229.70 11,8742 590.37 11 217.05 5,313.34 5.803 21 43174.28 12,04157 602.18 11.48139 5,419.61 50217 BALANCE SHEET Derating assets Non operating assets Total assets 89,011.00 5,563.00 94,574.00 160N 10N 170N 160.0% 10.0% 170 ON 50,791.42 5,67446 96,465.89 92.607 25 94,459.40 5,712.95 5,90171 98,395 21 100,363.11 96,34859 6.021.79 102,370.37 30.598.00 13 900.00 50,069.00 1619.00 8,345.00 55% 25% SON Operating abilities Non-Operating Liabilities Shareholder's equity Duted no. of shares Net Non operating Obligations (NNO) Non-oper Lab Non per assets WACO $5.0% 25.0% 90.0% 31,209.55 14.186.16 51.070.18 31.333.74 14 469.88 52,091.58 32,470.42 14 299.28 53.13341 33,119.33 15.05447 54,196.00 8,511.70 8,68193 3,855.57 9,032.68 2 NOPATEBIT. (Non-rexpo21 Net Operassets NOA Operating assets - Operating Lab) Increase in NOA 6002-24 58,413.00 3.325.35 6122.75 59,581.87 1 168.87 5.245.20 60,773.51 1,191,64 6370.11 61.988 98 1.215.47 6,49751 63,228.76 1.229.78 Free Cash Flow. FOI NOPAT - INCREASE IN NOIA 2.676 89 495387 5.053.56 5154.54 5.257.73 Value of firm PV of Future Free Cash Flows Value of Equity value ad fim. NNO Value pershare Value of equity/No. of shares Resident Operating income ROMNOPAT (NOA ber. WAGE 1,525 87 2,61797 2,670.29 2,723.70 2.778.17 PV of Future ROP Vale of fimm NOAPV of Future ROP Value of guity value of firmNNO Value per share Value of equity No. of shares What is the value of the firm using the Free Cash Flow model for Lowell Inc.? Lowell Inc.pdf OOOO 1.87,104,80 O 2.88,827 32 3. 93,230.72 None of the options provided 4. 84,876.92 5. LOWELL INC INCOME STATEMENT 2003 2019 Averro Adjusted 2020 2021 2022 ST GROWTH RATE 2 (palive to 2004 LT GROWTH RATT Operating expenses Derating income (CAM) Non operating expenses Table Income ( Tax Net income 5567.00 44,506,00 11,176.00 556.00 10 570.00 5.007.00 5563.00 100X ON 20N IN 19 9% 100 UN 80.ON 20.ON I ON 19 ON SOK 10.DK 54,744 64 45,395.71 11. JA 567.45 10,281 5,107.02 5.67446 5787353 46,301.63 11,5591 578 80 10.992.11 5,209.16 5282.95 59,03717 47,229.70 11,8742 590.37 11 217.05 5,313.34 5.803 21 43174.28 12,04157 602.18 11.48139 5,419.61 50217 BALANCE SHEET Derating assets Non operating assets Total assets 89,011.00 5,563.00 94,574.00 160N 10N 170N 160.0% 10.0% 170 ON 50,791.42 5,67446 96,465.89 92.607 25 94,459.40 5,712.95 5,90171 98,395 21 100,363.11 96,34859 6.021.79 102,370.37 30.598.00 13 900.00 50,069.00 1619.00 8,345.00 55% 25% SON Operating abilities Non-Operating Liabilities Shareholder's equity Duted no. of shares Net Non operating Obligations (NNO) Non-oper Lab Non per assets WACO $5.0% 25.0% 90.0% 31,209.55 14.186.16 51.070.18 31.333.74 14 469.88 52,091.58 32,470.42 14 299.28 53.13341 33,119.33 15.05447 54,196.00 8,511.70 8,68193 3,855.57 9,032.68 2 NOPATEBIT. (Non-rexpo21 Net Operassets NOA Operating assets - Operating Lab) Increase in NOA 6002-24 58,413.00 3.325.35 6122.75 59,581.87 1 168.87 5.245.20 60,773.51 1,191,64 6370.11 61.988 98 1.215.47 6,49751 63,228.76 1.229.78 Free Cash Flow. FOI NOPAT - INCREASE IN NOIA 2.676 89 495387 5.053.56 5154.54 5.257.73 Value of firm PV of Future Free Cash Flows Value of Equity value ad fim. NNO Value pershare Value of equity/No. of shares Resident Operating income ROMNOPAT (NOA ber. WAGE 1,525 87 2,61797 2,670.29 2,723.70 2.778.17 PV of Future ROP Vale of fimm NOAPV of Future ROP Value of guity value of firmNNO Value per share Value of equity No. of shares