Answered step by step
Verified Expert Solution
Question
1 Approved Answer
what is this answer about Financial Rations. we have to make the like second, third picture.... Description Using the database provided by Yahoo! Financial, search
what is this answer about Financial Rations. 

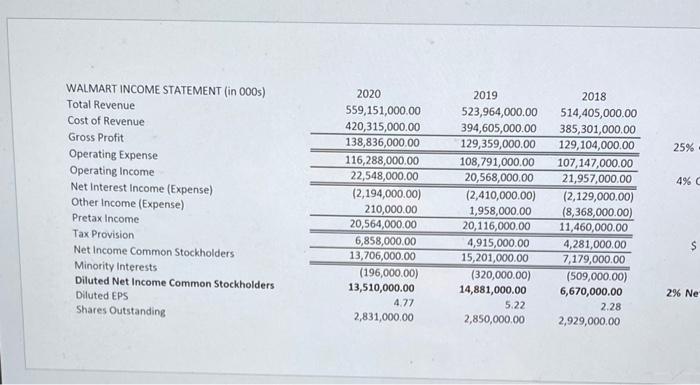
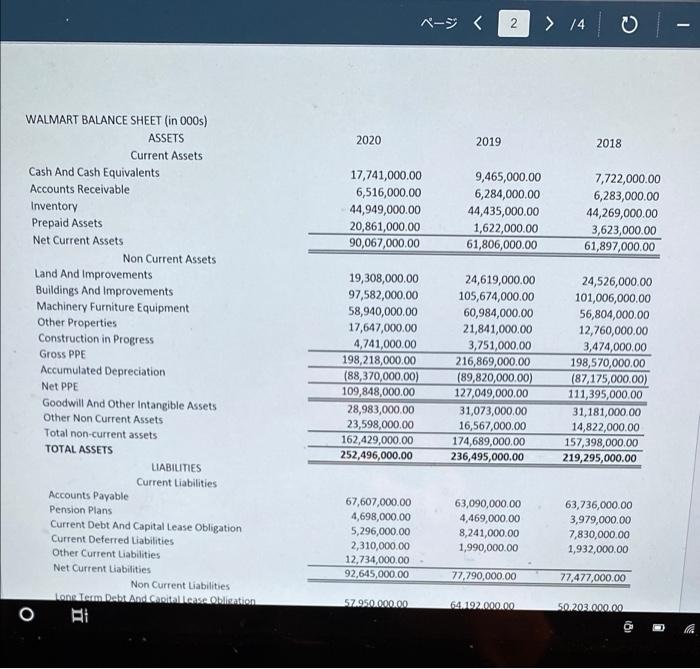
Description Using the database provided by Yahoo! Financial, search for Target and Kroger, and with the help of Excel, perform the 20 Ratio Analysis for years 2019 and 2020 for both corporations. On the Files section, I have modified the Excel file for Walmart, so you can use the formulas, and verify the accuracy of your previous assignment. 25% 4% WALMART INCOME STATEMENT (in 000s) Total Revenue Cost of Revenue Gross Profit Operating Expense Operating Income Net Interest Income (Expense) Other Income (Expense) Pretax Income Tax Provision Net Income Common Stockholders Minority Interests Diluted Net Income Common Stockholders Diluted EPS Shares Outstanding 2020 559,151,000.00 420,315,000.00 138,836,000.00 116,288,000.00 22,548,000.00 (2,194,000.00) 210,000.00 20,564,000.00 6,858,000.00 13,706,000.00 (196,000.00) 13,510,000.00 4.77 2,831,000.00 2019 523,964,000.00 394,605,000.00 129,359,000.00 108,791,000.00 20,568,000.00 (2,410,000.00) 1,958,000.00 20,116,000.00 4,915,000.00 15,201,000.00 (320,000.00) 14,881,000.00 5.22 2,850,000.00 2018 514,405,000.00 385,301,000.00 129,104,000.00 107,147,000.00 21,957,000.00 (2,129,000.00) (8,368,000.00) 11,460,000.00 4,281,000.00 7,179,000.00 (509,000.00) 6,670,000.00 2.28 2,929,000.00 $ 296 Ne N > 14 | - 2020 2019 2018 17,741,000.00 6,516,000.00 44,949,000.00 20,861,000.00 90,067,000.00 9,465,000.00 6,284,000.00 44,435,000.00 1,622,000.00 61,806,000.00 7,722,000.00 6,283,000.00 44,269,000.00 3,623,000.00 61,897,000.00 WALMART BALANCE SHEET (in 00s) ASSETS Current Assets Cash And Cash Equivalents Accounts Receivable Inventory Prepaid Assets Net Current Assets Non Current Assets Land And Improvements Buildings And Improvements Machinery Furniture Equipment Other Properties Construction in Progress Gross PPE Accumulated Depreciation Net PPE Goodwill And Other Intangible Assets Other Non Current Assets Total non-current assets TOTAL ASSETS LIABILITIES Current Liabilities Accounts Payable Pension Plans Current Debt And Capital Lease Obligation Current Deferred Liabilities Other Current Liabilities Net Current Liabilities Non Current Liabilities Ronn leam Ratud Cantaloncinin o BI 19,308,000.00 97,582,000.00 58,940,000.00 17,647,000.00 4,741,000.00 198,218,000.00 (88,370,000,00) 109,848,000.00 28,983,000.00 23,598,000.00 162,429,000.00 252,496,000.00 24,619,000.00 105,674,000.00 60,984,000.00 21,841,000.00 3,751,000.00 216,869,000.00 (89,820,000.00) 127,049,000.00 31,073,000.00 16,567,000.00 174,689,000.00 236,495,000.00 24,526,000.00 101,006,000.00 56,804,000.00 12,760,000.00 3,474,000.00 198,570,000.00 (87,175,000.00) 111,395,000.00 31,181,000.00 14,822,000.00 157,398,000.00 219,295,000.00 67,607,000.00 4,698,000.00 5,296,000.00 2,310,000.00 12,734,000.00 92,645,000.00 63,090,000.00 4,469,000.00 8,241,000.00 1,990,000.00 63,736,000.00 3,979,000.00 7,830,000.00 1,932,000.00 77.790,000.00 77,477,000.00 57950.000.00 6492.000.00 50.203.000.00 6 18 Description Using the database provided by Yahoo! Financial, search for Target and Kroger, and with the help of Excel, perform the 20 Ratio Analysis for years 2019 and 2020 for both corporations. On the Files section, I have modified the Excel file for Walmart, so you can use the formulas, and verify the accuracy of your previous assignment. 25% 4% WALMART INCOME STATEMENT (in 000s) Total Revenue Cost of Revenue Gross Profit Operating Expense Operating Income Net Interest Income (Expense) Other Income (Expense) Pretax Income Tax Provision Net Income Common Stockholders Minority Interests Diluted Net Income Common Stockholders Diluted EPS Shares Outstanding 2020 559,151,000.00 420,315,000.00 138,836,000.00 116,288,000.00 22,548,000.00 (2,194,000.00) 210,000.00 20,564,000.00 6,858,000.00 13,706,000.00 (196,000.00) 13,510,000.00 4.77 2,831,000.00 2019 523,964,000.00 394,605,000.00 129,359,000.00 108,791,000.00 20,568,000.00 (2,410,000.00) 1,958,000.00 20,116,000.00 4,915,000.00 15,201,000.00 (320,000.00) 14,881,000.00 5.22 2,850,000.00 2018 514,405,000.00 385,301,000.00 129,104,000.00 107,147,000.00 21,957,000.00 (2,129,000.00) (8,368,000.00) 11,460,000.00 4,281,000.00 7,179,000.00 (509,000.00) 6,670,000.00 2.28 2,929,000.00 $ 296 Ne N > 14 | - 2020 2019 2018 17,741,000.00 6,516,000.00 44,949,000.00 20,861,000.00 90,067,000.00 9,465,000.00 6,284,000.00 44,435,000.00 1,622,000.00 61,806,000.00 7,722,000.00 6,283,000.00 44,269,000.00 3,623,000.00 61,897,000.00 WALMART BALANCE SHEET (in 00s) ASSETS Current Assets Cash And Cash Equivalents Accounts Receivable Inventory Prepaid Assets Net Current Assets Non Current Assets Land And Improvements Buildings And Improvements Machinery Furniture Equipment Other Properties Construction in Progress Gross PPE Accumulated Depreciation Net PPE Goodwill And Other Intangible Assets Other Non Current Assets Total non-current assets TOTAL ASSETS LIABILITIES Current Liabilities Accounts Payable Pension Plans Current Debt And Capital Lease Obligation Current Deferred Liabilities Other Current Liabilities Net Current Liabilities Non Current Liabilities Ronn leam Ratud Cantaloncinin o BI 19,308,000.00 97,582,000.00 58,940,000.00 17,647,000.00 4,741,000.00 198,218,000.00 (88,370,000,00) 109,848,000.00 28,983,000.00 23,598,000.00 162,429,000.00 252,496,000.00 24,619,000.00 105,674,000.00 60,984,000.00 21,841,000.00 3,751,000.00 216,869,000.00 (89,820,000.00) 127,049,000.00 31,073,000.00 16,567,000.00 174,689,000.00 236,495,000.00 24,526,000.00 101,006,000.00 56,804,000.00 12,760,000.00 3,474,000.00 198,570,000.00 (87,175,000.00) 111,395,000.00 31,181,000.00 14,822,000.00 157,398,000.00 219,295,000.00 67,607,000.00 4,698,000.00 5,296,000.00 2,310,000.00 12,734,000.00 92,645,000.00 63,090,000.00 4,469,000.00 8,241,000.00 1,990,000.00 63,736,000.00 3,979,000.00 7,830,000.00 1,932,000.00 77.790,000.00 77,477,000.00 57950.000.00 6492.000.00 50.203.000.00 6 18 we have to make the like second, third picture.... 


Step by Step Solution
There are 3 Steps involved in it
Step: 1

Get Instant Access to Expert-Tailored Solutions
See step-by-step solutions with expert insights and AI powered tools for academic success
Step: 2

Step: 3

Ace Your Homework with AI
Get the answers you need in no time with our AI-driven, step-by-step assistance
Get Started


