

Question
What is this company, judging by this financial info? (It has to be an American company) And please tell me how you came up with
What is this company, judging by this financial info? (It has to be an American company) And please tell me how you came up with this answer.
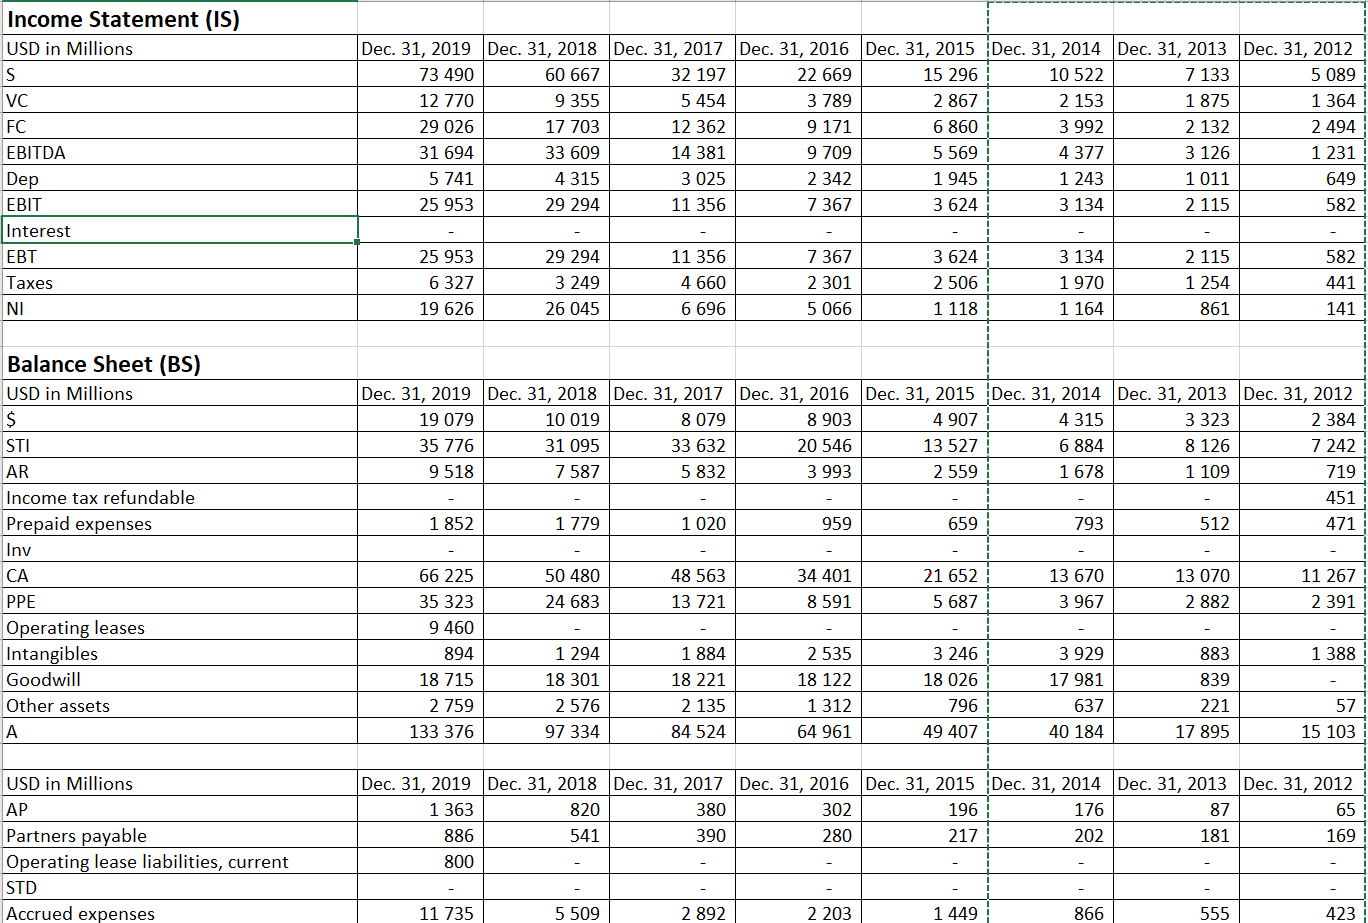
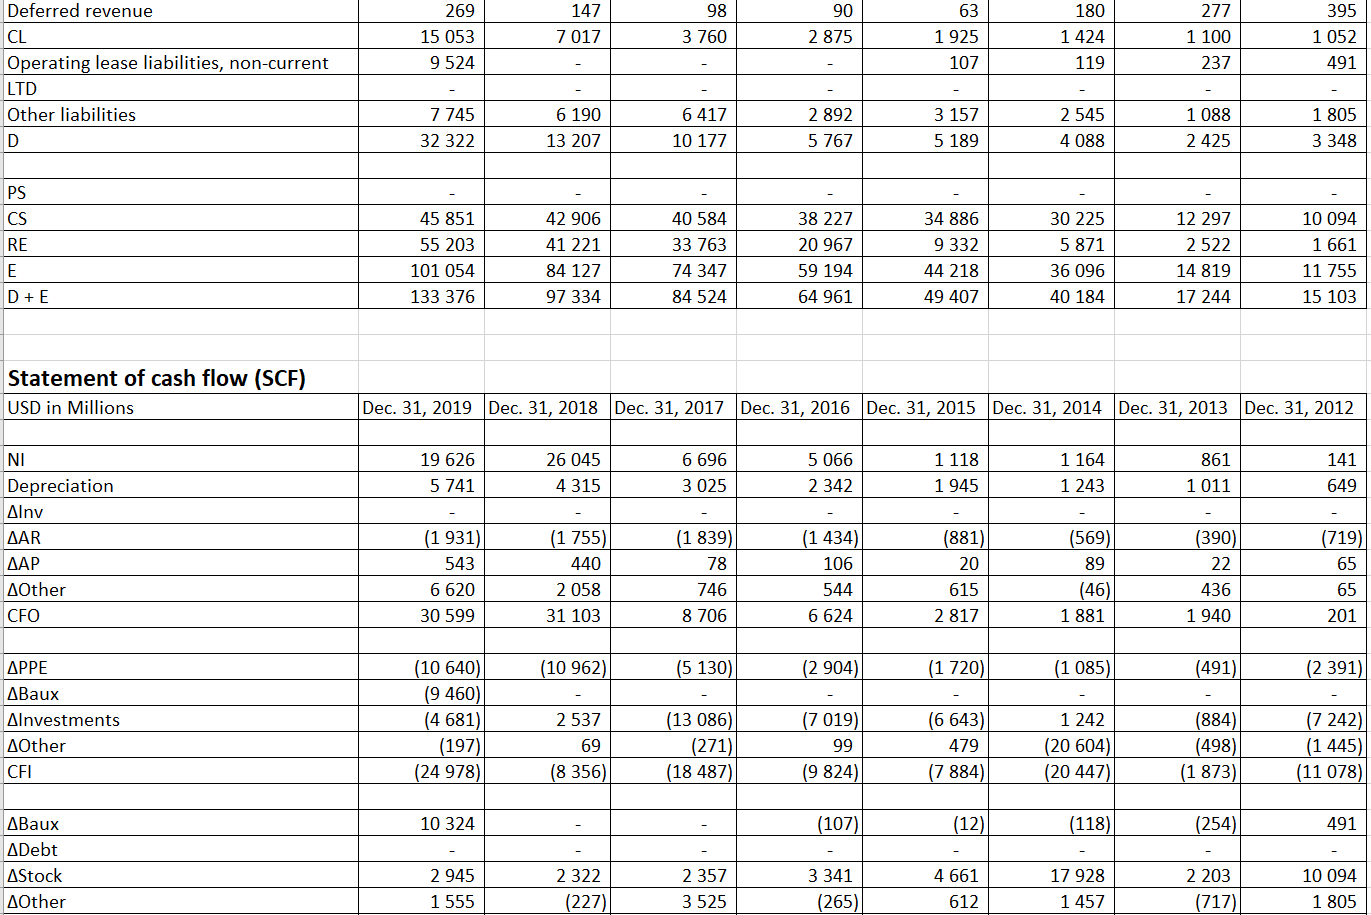
1) I know this company doesn't have inventory. They don't sell anything. A company offering some kind of services maybe?
2) Their revenue doubled from 2017 to 2018.
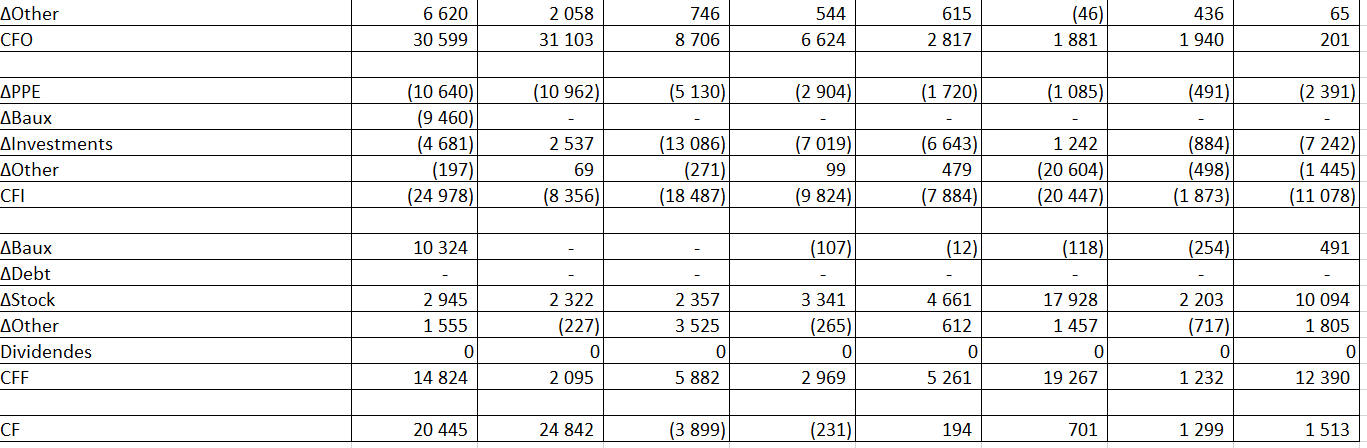
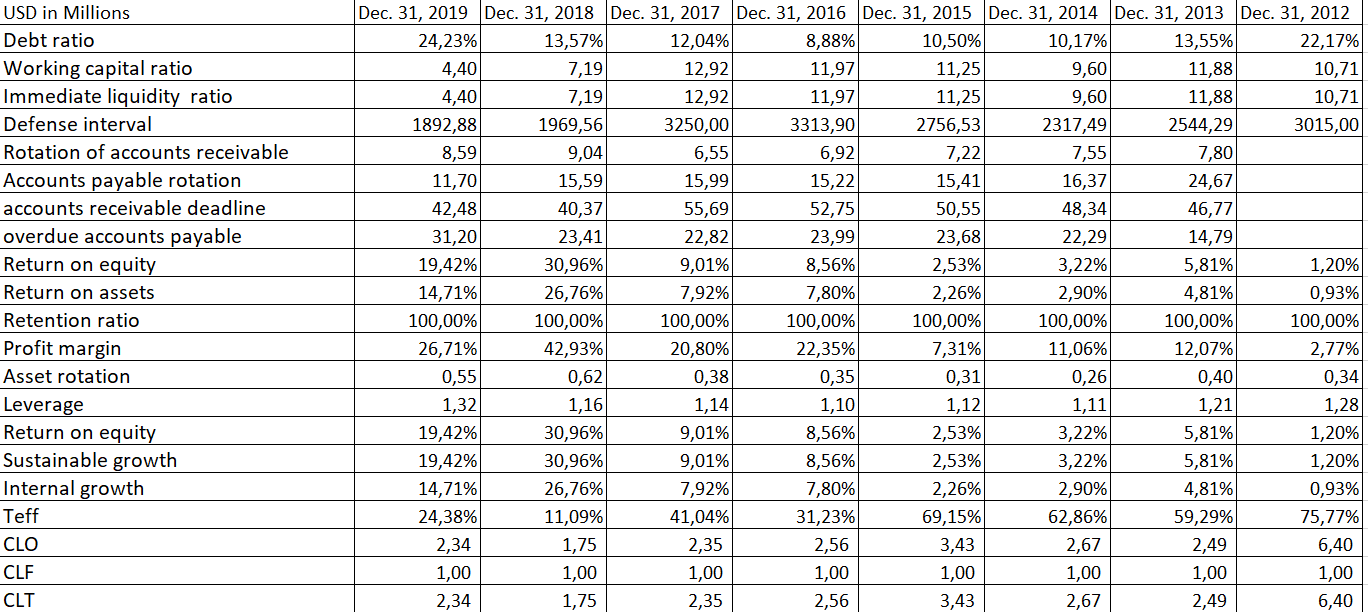
Income Statement (IS) USD in Millions S VC FC EBITDA Dep EBIT Dec. 31, 2019 Dec. 31, 2018 Dec. 31, 2017 Dec. 31, 2016 Dec. 31, 2015 Dec. 31, 2014 Dec. 31, 2013 Dec. 31, 2012 73 490 60 667 32 197 22 669 15 296 10 522 7 133 5 089 12 770 9355 5454 3 789 2 867 2 153 1 875 1 364 29 026 17 703 12 362 9 171 6 860 3 992 2 132 2494 31 694 33 609 14 381 9 709 5 569 4 377 3 126 1 231 5 741 4 315 3 025 2 342 1 945 1 243 1 011 649 25 953 29 294 11 356 7 367 3 624 3 134 2 115 582 Interest EBT Taxes NI 25 953 6 327 19 626 29 294 3 249 26 045 11 356 4 660 6 696 7 367 2 301 5 066 3 624 2 506 1 118 3 134 1 970 1 164 2 115 1 254 861 582 441 141 Dec. 31, 2019 Dec. 31, 2018 Dec. 31, 2017 Dec. 31, 2016 Dec. 31, 2015 Dec. 31, 2014 Dec. 31, 2013 Dec. 31, 2012 19 079 10 019 8 079 8 903 4 907 4 315 3 323 2 384 35 776 31 095 33 632 20 546 13 527 6 884 8 126 7 242 9518 7 587 5832 3 993 2 559 1 678 1 109 719 451 1 852 1 779 1 020 959 659 793 512 471 Balance Sheet (BS) USD in Millions $ STI AR Income tax refundable Prepaid expenses Inv CA PPE Operating leases Intangibles Goodwill Other assets A 50 480 24 683 48 563 13 721 34 401 8 591 21 652 5 687 13 670 3967 13 070 2 882 11 267 2 391 66 225 35 323 9460 894 18 715 2 759 133 376 1 294 1 388 18 301 2 576 97 334 1 884 18 221 2 135 84 524 2535 18 122 1 312 64 961 3 246 18 026 796 49 407 3 929 17 981 637 40 184 883 839 221 17 895 57 15 103 USD in Millions AP Partners payable Operating lease liabilities, current STD Accrued expenses Dec. 31, 2019 Dec. 31, 2018 Dec. 31, 2017 Dec. 31, 2016 Dec. 31, 2015 Dec. 31, 2014 Dec. 31, 2013 Dec. 31, 2012 1 363 820 380 302 196 176 87 65 886 541 390 280 217 202 181 169 800 11 735 5 509 2 892 2 203 1 449 866 555 423 98 63 395 269 15 053 9524 147 7 017 90 2875 Deferred revenue CL Operating lease liabilities, non-current LTD Other liabilities 3 760 1 925 107 180 1 424 119 277 1 100 237 1 052 491 6417 7 745 32 322 6 190 13 207 2 892 5 767 3 157 5 189 2 545 4 088 1 088 2425 1 805 3 348 D 10 177 PS CS RE E D+E 45 851 55 203 101 054 133 376 42 906 41 221 84 127 97 334 40 584 33 763 74 347 84 524 38 227 20 967 59 194 64 961 34 886 9 332 44 218 49 407 30 225 5 871 36 096 40 184 12 297 2 522 14 819 17 244 10 094 1 661 11 755 15 103 Statement of cash flow (SCF) USD in Millions Dec. 31, 2019 Dec. 31, 2018 Dec. 31, 2017 Dec. 31, 2016 Dec. 31, 2015 Dec. 31, 2014 Dec. 31, 2013 Dec. 31, 2012 1 118 19 626 5 741 26 045 4 315 6 696 3 025 5 066 2 342 1 164 1 243 861 1 011 141 649 1 945 NI Depreciation AAR AOther CFO (1 434) 106 (390) 22 (1 931) 543 6 620 30 599 (1 755) 440 2 058 31 103 (1 839) 78 746 8 706 (881) 20 615 2 817 (569) 89 (46) 1 881 (719) 65 65 201 544 436 1 940 6 624 (10 962) (5 130) (2 904) (1 720) (1 085) (491) (2 391) APPE ABaux Alnvestments AOther CFI (10 640) (9 460) (4 681) (197) (24 978) 2537 69 (8 356) (13 086) (271) (18 487) (7 019) 99 (9 824) (6 643) 479 (7 884) 1 242 (20 604) (20 447) (884) (498) (1 873) (7 242) (1 445) (11 078) 10 324 (107) (12) (118) (254) 491 ABaux ADebt AStock AOther 2945 1 555 2 322 (227) 2 357 3525 3 341 (265) 4 661 612 17 928 1457 2 203 (717) 10 094 1 805 746 544 615 436 AOther CFO 6 620 30 599 2 058 31 103 (46) 1 881 65 201 8 706 6 624 2 817 1 940 (10 962) (5 130) (2.904) (1 720) (1 085) (491) (2 391 APPE ABaux Alnvestments AOther CFI (10 640) (9 460) (4 681) (197) (24 978) 2537 69 (8 356) (13 086) (271) (18 487) (7 019) 99 (9 824) (6 643) 479 (7 884) 1 242 (20 604) (20 447) (884) (498) (1 873) (7 242) (1 445) (11 078) 10 324 (107) (12) (118) (254) 491 ABaux ADebt AStock AOther Dividendes CFF 2945 1 555 2 357 3 525 3 341 (265) 0 4 661 612 17 928 1 457 2 322 (227) 0 2 095 2 203 (717) 0 10 094 1 805 0 0 0 0 14 824 5 882 2969 5 261 19 267 1 232 12 390 CF 20 445 24 842 (3 899) (231) 194 701 1 299 1 513 USD in Millions Debt ratio Working capital ratio Immediate liquidity ratio Defense interval Rotation of accounts receivable Accounts payable rotation accounts receivable deadline overdue accounts payable Return on equity Return on assets Retention ratio Profit margin Asset rotation Leverage Return on equity Sustainable growth Internal growth Teff CLO CLF CLT Dec. 31, 2019 Dec. 31, 2018 Dec. 31, 2017 Dec. 31, 2016 Dec. 31, 2015 Dec. 31, 2014 Dec. 31, 2013 Dec. 31, 2012 24,23% 13,57% 12,04% 8,88% 10,50% 10,17% 13,55% 22,17% 4,401 7,19 12,92 11,97 11,25 9,60 11,88 10,71 4,40 7,19 12,92 11,97 11,25 9,60 11,88 10,71 1892,88 1969,56 3250,00 3313,90 2756,53 2317,49 2544,29 3015,00 8,59 9,04 6,55 6,92 7,22 7,55 7,80 11,70 15,59 15,99 15,22 15,41 16,37 24,67 42,48 40,37 55,69 52,75 50,55 48,34 46,77 31,20 23,41 22,82 23,99 23,68 22,29 14,79 19,42% 30,96% 9,01% 8,56% 2,53% 3,22% 5,81% 1,20% 14,71% 26,76% 7,92% 7,80% 2,26% 2,90% 4,81% 0,93% 100,00% 100,00% 100,00% 100,00% 100,00% 100,00% 100,00% 100,00% 26,71% 42,93% 20,80% 22,35% 7,31% 11,06% 12,07% 2,77% 0,55 0,62 0,38 0,35 0,31 0,26 0,40 0,34 1,32 1,16 1,14 1,10 1,12 1,11 1,21 1,28 19,42% 30,96% 9,01% 8,56% 2,53% 3,22% 5,81% 1,20% 19,42% 30,96% 9,01% 8,56% 2,53% 3,22% 5,81% 1,20% 14,71% 26,76% 7,92% 7,80% 2,26% 2,90% 4,81% 0,93% 24,38% 11,09% 41,04% 31,23% 69,15% 62,86% 59,29% 75,77% 2,34 1,75 2,35 2,56 3,43 2,67 2,49 6,40 1,00 1,00 1,00 1,00 1,00 1,00 1,00 2,34 1,75 2,35 2,56 3,43 2,67 2,49 6,40 1,00 Income Statement (IS) USD in Millions S VC FC EBITDA Dep EBIT Dec. 31, 2019 Dec. 31, 2018 Dec. 31, 2017 Dec. 31, 2016 Dec. 31, 2015 Dec. 31, 2014 Dec. 31, 2013 Dec. 31, 2012 73 490 60 667 32 197 22 669 15 296 10 522 7 133 5 089 12 770 9355 5454 3 789 2 867 2 153 1 875 1 364 29 026 17 703 12 362 9 171 6 860 3 992 2 132 2494 31 694 33 609 14 381 9 709 5 569 4 377 3 126 1 231 5 741 4 315 3 025 2 342 1 945 1 243 1 011 649 25 953 29 294 11 356 7 367 3 624 3 134 2 115 582 Interest EBT Taxes NI 25 953 6 327 19 626 29 294 3 249 26 045 11 356 4 660 6 696 7 367 2 301 5 066 3 624 2 506 1 118 3 134 1 970 1 164 2 115 1 254 861 582 441 141 Dec. 31, 2019 Dec. 31, 2018 Dec. 31, 2017 Dec. 31, 2016 Dec. 31, 2015 Dec. 31, 2014 Dec. 31, 2013 Dec. 31, 2012 19 079 10 019 8 079 8 903 4 907 4 315 3 323 2 384 35 776 31 095 33 632 20 546 13 527 6 884 8 126 7 242 9518 7 587 5832 3 993 2 559 1 678 1 109 719 451 1 852 1 779 1 020 959 659 793 512 471 Balance Sheet (BS) USD in Millions $ STI AR Income tax refundable Prepaid expenses Inv CA PPE Operating leases Intangibles Goodwill Other assets A 50 480 24 683 48 563 13 721 34 401 8 591 21 652 5 687 13 670 3967 13 070 2 882 11 267 2 391 66 225 35 323 9460 894 18 715 2 759 133 376 1 294 1 388 18 301 2 576 97 334 1 884 18 221 2 135 84 524 2535 18 122 1 312 64 961 3 246 18 026 796 49 407 3 929 17 981 637 40 184 883 839 221 17 895 57 15 103 USD in Millions AP Partners payable Operating lease liabilities, current STD Accrued expenses Dec. 31, 2019 Dec. 31, 2018 Dec. 31, 2017 Dec. 31, 2016 Dec. 31, 2015 Dec. 31, 2014 Dec. 31, 2013 Dec. 31, 2012 1 363 820 380 302 196 176 87 65 886 541 390 280 217 202 181 169 800 11 735 5 509 2 892 2 203 1 449 866 555 423 98 63 395 269 15 053 9524 147 7 017 90 2875 Deferred revenue CL Operating lease liabilities, non-current LTD Other liabilities 3 760 1 925 107 180 1 424 119 277 1 100 237 1 052 491 6417 7 745 32 322 6 190 13 207 2 892 5 767 3 157 5 189 2 545 4 088 1 088 2425 1 805 3 348 D 10 177 PS CS RE E D+E 45 851 55 203 101 054 133 376 42 906 41 221 84 127 97 334 40 584 33 763 74 347 84 524 38 227 20 967 59 194 64 961 34 886 9 332 44 218 49 407 30 225 5 871 36 096 40 184 12 297 2 522 14 819 17 244 10 094 1 661 11 755 15 103 Statement of cash flow (SCF) USD in Millions Dec. 31, 2019 Dec. 31, 2018 Dec. 31, 2017 Dec. 31, 2016 Dec. 31, 2015 Dec. 31, 2014 Dec. 31, 2013 Dec. 31, 2012 1 118 19 626 5 741 26 045 4 315 6 696 3 025 5 066 2 342 1 164 1 243 861 1 011 141 649 1 945 NI Depreciation AAR AOther CFO (1 434) 106 (390) 22 (1 931) 543 6 620 30 599 (1 755) 440 2 058 31 103 (1 839) 78 746 8 706 (881) 20 615 2 817 (569) 89 (46) 1 881 (719) 65 65 201 544 436 1 940 6 624 (10 962) (5 130) (2 904) (1 720) (1 085) (491) (2 391) APPE ABaux Alnvestments AOther CFI (10 640) (9 460) (4 681) (197) (24 978) 2537 69 (8 356) (13 086) (271) (18 487) (7 019) 99 (9 824) (6 643) 479 (7 884) 1 242 (20 604) (20 447) (884) (498) (1 873) (7 242) (1 445) (11 078) 10 324 (107) (12) (118) (254) 491 ABaux ADebt AStock AOther 2945 1 555 2 322 (227) 2 357 3525 3 341 (265) 4 661 612 17 928 1457 2 203 (717) 10 094 1 805 746 544 615 436 AOther CFO 6 620 30 599 2 058 31 103 (46) 1 881 65 201 8 706 6 624 2 817 1 940 (10 962) (5 130) (2.904) (1 720) (1 085) (491) (2 391 APPE ABaux Alnvestments AOther CFI (10 640) (9 460) (4 681) (197) (24 978) 2537 69 (8 356) (13 086) (271) (18 487) (7 019) 99 (9 824) (6 643) 479 (7 884) 1 242 (20 604) (20 447) (884) (498) (1 873) (7 242) (1 445) (11 078) 10 324 (107) (12) (118) (254) 491 ABaux ADebt AStock AOther Dividendes CFF 2945 1 555 2 357 3 525 3 341 (265) 0 4 661 612 17 928 1 457 2 322 (227) 0 2 095 2 203 (717) 0 10 094 1 805 0 0 0 0 14 824 5 882 2969 5 261 19 267 1 232 12 390 CF 20 445 24 842 (3 899) (231) 194 701 1 299 1 513 USD in Millions Debt ratio Working capital ratio Immediate liquidity ratio Defense interval Rotation of accounts receivable Accounts payable rotation accounts receivable deadline overdue accounts payable Return on equity Return on assets Retention ratio Profit margin Asset rotation Leverage Return on equity Sustainable growth Internal growth Teff CLO CLF CLT Dec. 31, 2019 Dec. 31, 2018 Dec. 31, 2017 Dec. 31, 2016 Dec. 31, 2015 Dec. 31, 2014 Dec. 31, 2013 Dec. 31, 2012 24,23% 13,57% 12,04% 8,88% 10,50% 10,17% 13,55% 22,17% 4,401 7,19 12,92 11,97 11,25 9,60 11,88 10,71 4,40 7,19 12,92 11,97 11,25 9,60 11,88 10,71 1892,88 1969,56 3250,00 3313,90 2756,53 2317,49 2544,29 3015,00 8,59 9,04 6,55 6,92 7,22 7,55 7,80 11,70 15,59 15,99 15,22 15,41 16,37 24,67 42,48 40,37 55,69 52,75 50,55 48,34 46,77 31,20 23,41 22,82 23,99 23,68 22,29 14,79 19,42% 30,96% 9,01% 8,56% 2,53% 3,22% 5,81% 1,20% 14,71% 26,76% 7,92% 7,80% 2,26% 2,90% 4,81% 0,93% 100,00% 100,00% 100,00% 100,00% 100,00% 100,00% 100,00% 100,00% 26,71% 42,93% 20,80% 22,35% 7,31% 11,06% 12,07% 2,77% 0,55 0,62 0,38 0,35 0,31 0,26 0,40 0,34 1,32 1,16 1,14 1,10 1,12 1,11 1,21 1,28 19,42% 30,96% 9,01% 8,56% 2,53% 3,22% 5,81% 1,20% 19,42% 30,96% 9,01% 8,56% 2,53% 3,22% 5,81% 1,20% 14,71% 26,76% 7,92% 7,80% 2,26% 2,90% 4,81% 0,93% 24,38% 11,09% 41,04% 31,23% 69,15% 62,86% 59,29% 75,77% 2,34 1,75 2,35 2,56 3,43 2,67 2,49 6,40 1,00 1,00 1,00 1,00 1,00 1,00 1,00 2,34 1,75 2,35 2,56 3,43 2,67 2,49 6,40 1,00Step by Step Solution
There are 3 Steps involved in it
Step: 1

Get Instant Access to Expert-Tailored Solutions
See step-by-step solutions with expert insights and AI powered tools for academic success
Step: 2

Step: 3
Ace Your Homework with AI
Get the answers you need in no time with our AI-driven, step-by-step assistance
Get Started
Local Public Finance
Authors: René Geissler, Gerhard Hammerschmid, Christian Raffer
1st Edition
3030674681, 978-3030674687