What is UPS's (stock) value estimate based on FedEx's PB and PE ratios? Please show your calculation.
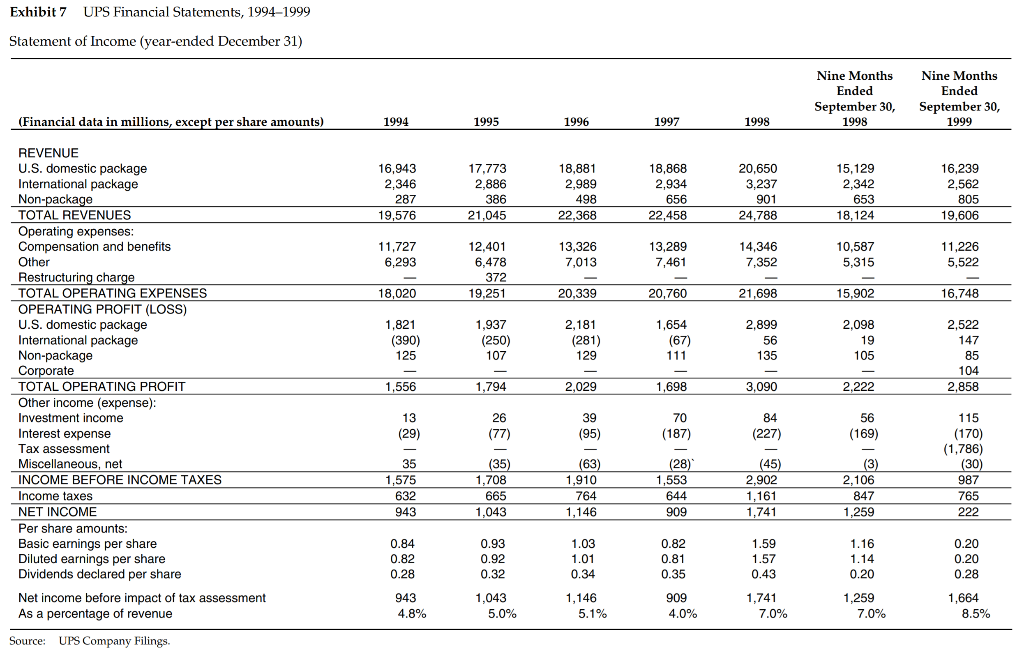
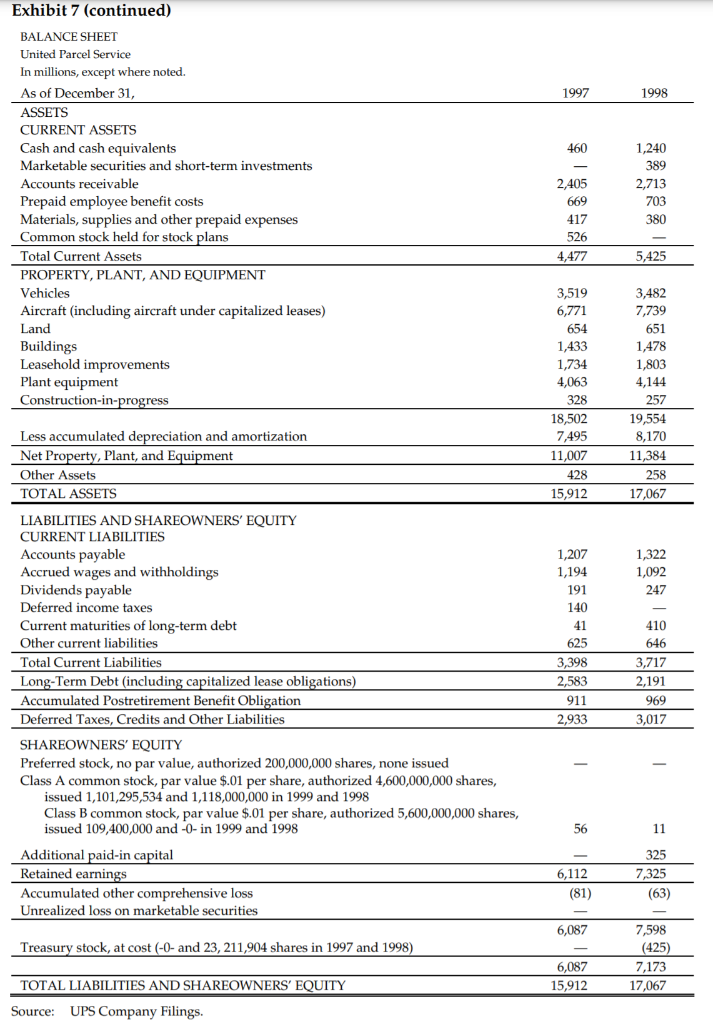
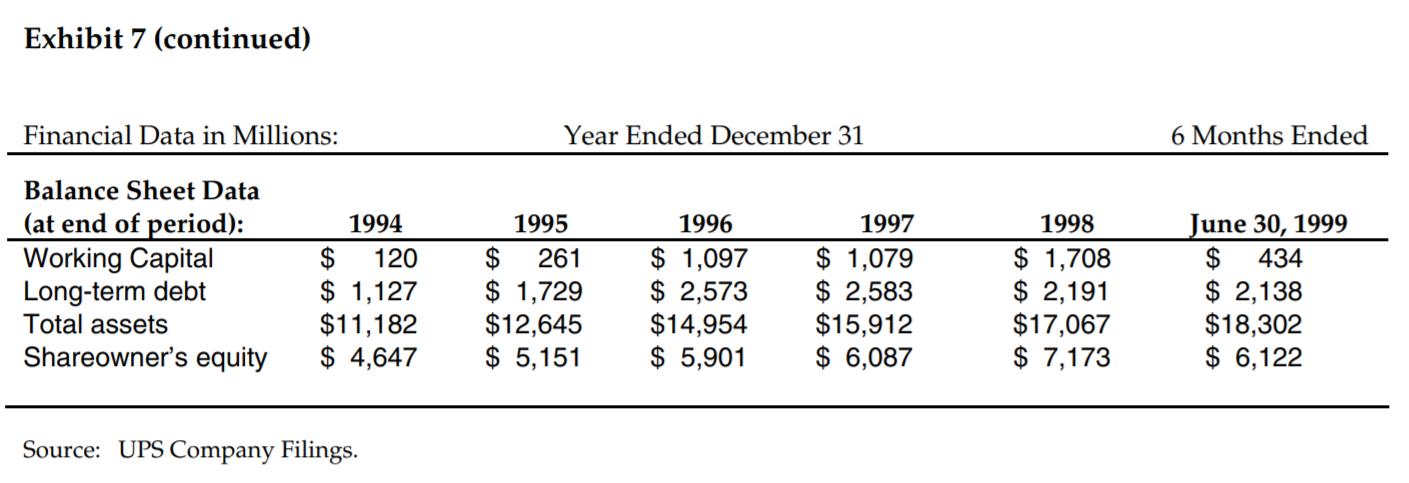
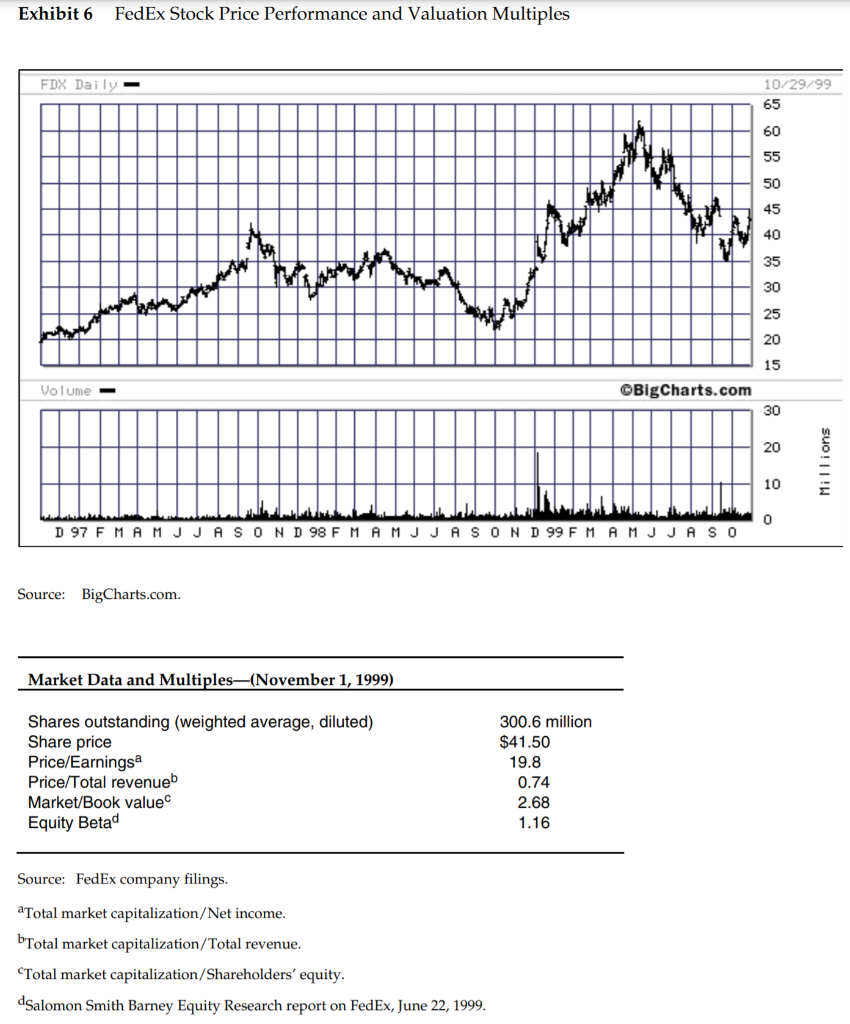
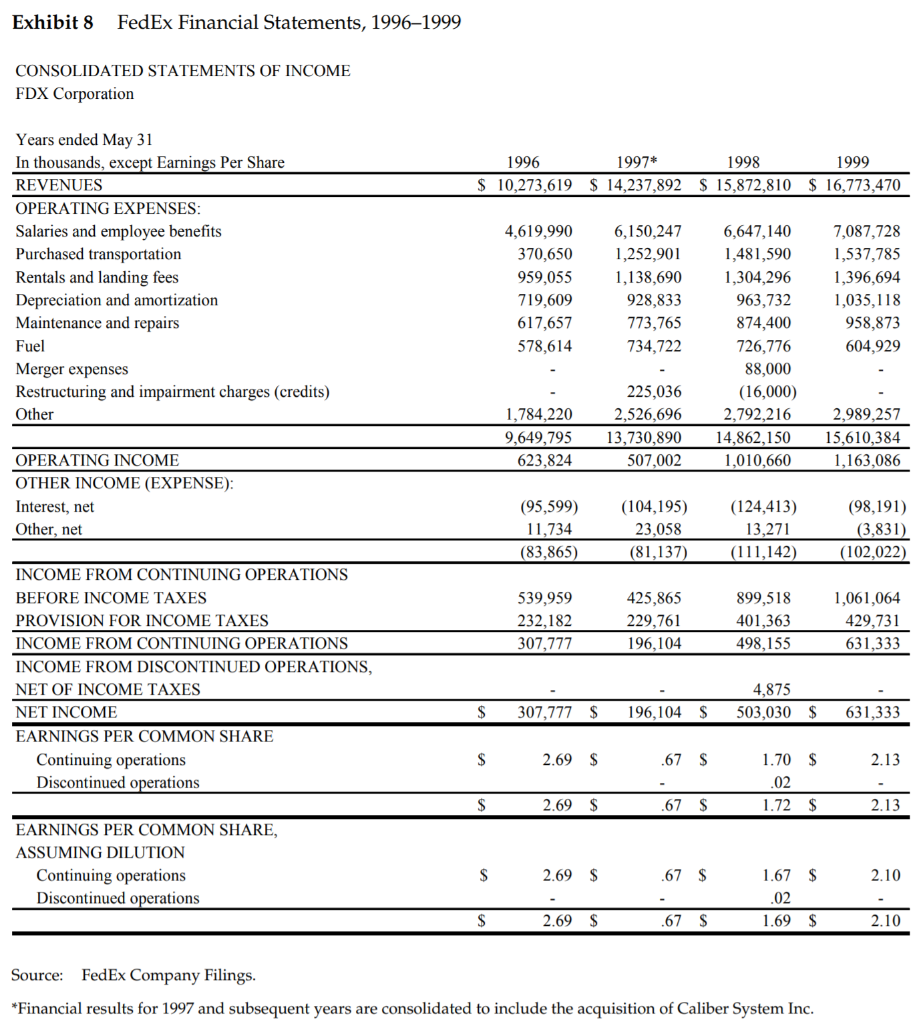
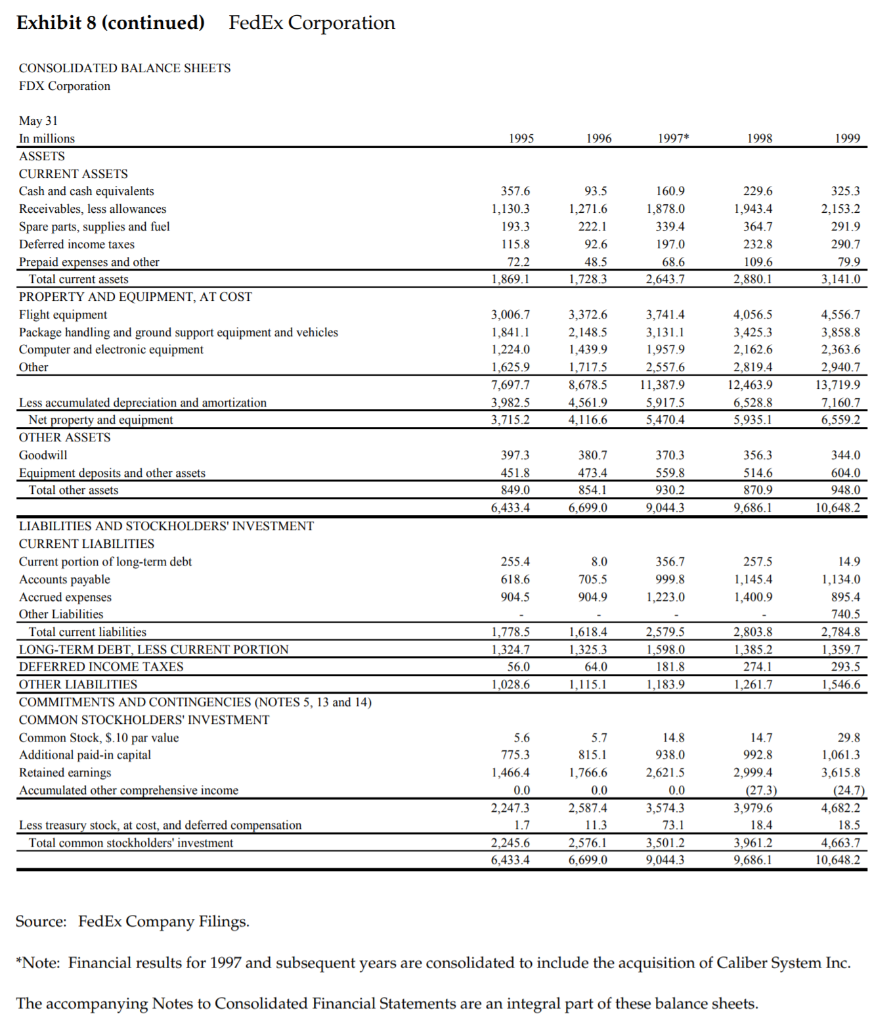
Exhibit 7 UPS Financial Statements, 19941999 Statement of Income (year-ended December 31) Nine Months Ended September 30, 1998 Nine Months Ended September 30, 1999 (Financial data in millions, except per share amounts) 1994 1995 1996 1997 1998 20,650 16,943 2,346 287 19,576 17.773 2,886 386 21,045 18,881 2,989 498 22,368 18,868 2,934 656 22,458 3,237 901 24,788 15,129 2,342 653 18,124 16,239 2,562 805 19,606 11,727 6,293 13,326 7,013 13,289 7,461 14,346 7,352 12,401 6,478 372 19,251 10.587 5,315 11,226 5,522 18,020 20,339 20,760 21,698 15,902 16,748 1,821 (390) 125 1,937 (250) 107 2,181 (281) 129 1,654 (67) 111 2,899 56 135 2,098 19 105 REVENUE U.S. domestic package International package Non-package TOTAL REVENUES Operating expenses: Compensation and benefits Other Restructuring charge TOTA TOTAL OPERATING EXPENSES 0 OPERATING PROFIT (LOSS) U.S. domestic package International package Non-package Corporate TOTAL OPERATING PROFIT Other income (expense): Investment income Interest expense Tax assessment Miscellaneous, net INCOME BEFORE INCOME TAXES Income taxes NET INCOME Per share amounts: Basic earnings per share Diluted earnings per share Dividends declared per share Net income before impact of tax assessment As a percentage of revenue 2,522 147 85 104 2,858 - 1,556 1,794 2,029 1,698 3,090 2,222 13 (29) 26 (77) 39 (95) 70 (187) 84 (227) 56 (169) 35 1,575 632 943 (35) 1,708 665 1,043 (63) 1,910 764 1,146 (28) 1,553 644 909 (45) 2.902 1,161 1.741 (3) 2,106 847 1.259 115 (170) (1,786) (30) 987 765 222 0.84 0.82 0.93 0.92 0.32 1.03 1.01 0.34 0.82 0.81 0.35 1.59 1.57 0.43 1.16 1.14 0.20 0.20 0.20 0.28 0.28 943 4.8% 1,043 5.0% 1,146 5.1% 909 4.0% 1,741 7.0% 1,259 7.0% 1,664 8.5% Source: UPS Company Filings. Exhibit 7 (continued) 1997 1998 460 BALANCE SHEET United Parcel Service In millions, except where noted. As of December 31, ASSETS CURRENT ASSETS Cash and cash equivalents Marketable securities and short-term investments Accounts receivable Prepaid employee benefit costs Materials, supplies and other prepaid expenses Common stock held for stock plans Total Current Assets PROPERTY, PLANT, AND EQUIPMENT Vehicles Aircraft (including aircraft under capitalized leases) Land Buildings Leasehold improvements Plant equipment Construction-in-progress 2,405 669 417 526 4,477 1,240 389 2,713 703 380 5,425 3,519 6,771 654 1,433 1,734 4,063 328 18,502 7,495 11,007 428 15,912 3,482 7,739 651 1,478 1,803 4,144 257 19,554 8,170 11,384 258 17,067 Less accumulated depreciation and amortization Net Property, Plant, and Equipment Other Assets TOTAL ASSETS 1,322 1,092 247 1,207 1,194 191 140 41 625 3,398 2.583 LIABILITIES AND SHAREOWNERS' EQUITY CURRENT LIABILITIES Accounts payable Accrued wages and withholdings Dividends payable Deferred income taxes Current maturities of long-term debt Other current liabilities Total Current Liabilities Long-Term Debt (including capitalized lease obligations) Accumulated Postretirement Benefit Obligation Deferred Taxes, Credits and Other Liabilities SHAREOWNERS' EQUITY Preferred stock, no par value, authorized 200,000,000 shares, none issued Class A common stock, par value $.01 per share, authorized 4,600,000,000 shares, issued 1,101,295,534 and 1,118,000,000 in 1999 and 1998 Class B common stock, par value $.01 per share, authorized 5,600,000,000 shares, issued 109,400,000 and -- in 1999 and 1998 Additional paid-in capital Retained earnings Accumulated other comprehensive loss Unrealized loss on marketable securities 410 646 3,717 2,191 969 3,017 911 2,933 - - 56 11 6,112 (81) 325 7,325 (63) 6,087 Treasury stock, at cost (-0- and 23, 211,904 shares in 1997 and 1998) 7,598 (425) 7,173 17,067 6,087 15,912 TOTAL LIABILITIES AND SHAREOWNERS' EQUITY Source: UPS Company Filings. Exhibit 7 (continued) Financial Data in Millions: Year Ended December 31 6 Months Ended Balance Sheet Data (at end of period): Working Capital Long-term debt Total assets Shareowner's equity 1994 $ 120 $ 1,127 $11,182 $ 4,647 1995 $ 261 $ 1,729 $12,645 $ 5,151 1996 $ 1,097 $ 2,573 $14,954 $ 5,901 1997 $ 1,079 $ 2,583 $15,912 $ 6,087 1998 $ 1,708 $ 2,191 $17,067 $ 7,173 June 30, 1999 $ 434 $ 2,138 $18,302 $ 6,122 Source: UPS Company Filings. Exhibit 6 FedEx Stock Price Performance and Valuation Multiples FDX Dails - 10/29/99 65 60 55 50 45 40 35 30 25 20 15 Volume - BigCharts.com 30 20 Millions 0 D 97 F M A M J J A S O N D 98 F M A M J J A S O N D 99 F M A M J J A S O Source: BigCharts.com. Market Data and Multiples(November 1, 1999) Shares outstanding (weighted average, diluted) Share price Price/Earningsa Price/Total revenueb Market/Book value Equity Betad 300.6 million $41.50 19.8 0.74 2.68 1.16 Source: FedEx company filings. a Total market capitalization/Net income. bTotal market capitalization/Total revenue. Total market capitalization/Shareholders' equity. dSalomon Smith Barney Equity Research report on FedEx, June 22, 1999. Exhibit 8 FedEx Financial Statements, 1996-1999 CONSOLIDATED STATEMENTS OF INCOME FDX Corporation 1996 $ 10,273,619 1997* $ 14,237,892 1998 1999 $ 15,872,810 $ 16,773,470 Years ended May 31 In thousands, except Earnings Per Share REVENUES OPERATING EXPENSES: Salaries and employee benefits Purchased transportation Rentals and landing fees Depreciation and amortization Maintenance and repairs Fuel Merger expenses Restructuring and impairment charges (credits) Other 4,619,990 370,650 959,055 719,609 617,657 578,614 6,150,247 1,252,901 1,138,690 928,833 773,765 734,722 6,647,140 1,481,590 1,304,296 963,732 874,400 726,776 88,000 (16,000) 2,792,216 14,862,150 1,010,660 7,087,728 1,537,785 1,396,694 1,035,118 958,873 604,929 1,784,220 9,649,795 623,824 225,036 2,526,696 13,730,890 507,002 2,989,257 15,610,384 1,163,086 OPERATING INCOME OTHER INCOME (EXPENSE): Interest, net Other, net (95,599) 11,734 (83,865) (104,195) 23,058 (81,137) (124,413) 13,271 (111,142) (98,191) (3,831) (102,022) 539,959 232,182 307,777 425,865 229,761 196,104 899,518 401,363 498,155 1,061,064 429,731 631,333 INCOME FROM CONTINUING OPERATIONS BEFORE INCOME TAXES PROVISION FOR INCOME TAXES INCOME FROM CONTINUING OPERATIONS INCOME FROM DISCONTINUED OPERATIONS, NET OF INCOME TAXES NET INCOME EARNINGS PER COMMON SHARE Continuing operations Discontinued operations 4,875 503,030 $ $ 307,777 $ 196,104 S 631,333 $ 2.69 $ .67 S 2.13 1.70 $ .02 1.72 $ $ 2.69 $ .67 $ 2.13 EARNINGS PER COMMON SHARE, ASSUMING DILUTION Continuing operations Discontinued operations $ 2.69 $ .67 $ 2.10 1.67 $ .02 1.69 $ $ 2.69 $ .67 $ 2.10 Source: FedEx Company Filings. *Financial results for 1997 and subsequent years are consolidated to include the acquisition of Caliber System Inc. Exhibit 8 (continued) FedEx Corporation CONSOLIDATED BALANCE SHEETS FDX Corporation 1995 1996 1997 1998 1999 May 31 In millions ASSETS CURRENT ASSETS Cash and cash equivalents Receivables, less allowances Spare parts, supplies and fuel Deferred income taxes Prepaid expenses and other Total current assets PROPERTY AND EQUIPMENT, AT COST Flight equipment Package handling and ground support equipment and vehicles Computer and electronic equipment Other 357.6 1,130.3 1933 115.8 72.2 1,869.1 93.5 1,271.6 222.1 92.6 48.5 1,728,3 160.9 1,878.0 339.4 197.0 68.6 2,643.7 229,6 1,943.4 364.7 232.8 109.6 2.880.1 325.3 2,153.2 291.9 290.7 79.9 3,141.0 3,006.7 1,841.1 1,224.0 1,625.9 7,697.7 3,982.5 3.715.2 3,372.6 2.148.5 1,4399 1,717.5 8,678.5 4,561.9 4,116.6 3,741.4 3,1311 1,9579 2,557.6 11,387.9 5,917.5 5,470.4 4,056.5 3,425.3 2.162.6 2,819.4 12,463.9 6,528.8 5,935.1 4,556.7 3,858.8 2,363.6 2.940.7 13,719.9 7,160.7 6,5592 Less accumulated depreciation and amortization Net property and equipment OTHER ASSETS Goodwill Equipment deposits and other assets Total other assets 397.3 451.8 849.0 6,433.4 380.7 473.4 854.1 6,699.0 370.3 559.8 930.2 9,044.3 356.3 514.6 870.9 9,686.1 344.0 604.0 948.0 10,648.2 255.4 618.6 904.5 8.0 705.5 904.9 356.7 999.8 1,223.0 257.5 1.145.4 1,400.9 LIABILITIES AND STOCKHOLDERS' INVESTMENT CURRENT LIABILITIES Current portion of long-term debt Accounts payable Accrued expenses Other Liabilities Total current liabilities LONG-TERM DEBT, LESS CURRENT PORTION DEFERRED INCOME TAXES OTHER LIABILITIES COMMITMENTS AND CONTINGENCIES (NOTES 5, 13 and 14) COMMON STOCKHOLDERS' INVESTMENT Common Stock, $.10 par value Additional paid-in capital Retained earnings Accumulated other comprehensive income 14.9 1.134.0 895.4 740.5 2,784.8 1,359.7 293.5 1,546.6 1,778.5 1.324.7 56.0 1,028.6 1,618.4 1.325.3 64.0 1.115.1 2,579.5 1,598,0 181.8 1,183.9 2,803.8 1,385.2 274.1 1,261.7 5.7 5.6 775.3 1,466.4 0.0 2,247.3 1.7 2.245.6 6,433.4 815.1 1,766.6 0.0 2,587.4 11.3 2,576.1 6,699.0 14.8 938.0 2,621.5 0.0 3,574.3 73.1 3,501.2 9,044.3 14.7 992.8 2,999.4 (27.3) 3,979.6 18.4 3,961.2 9,686.1 29.8 1,061.3 3,615.8 (24.7) 4,682.2 18.5 4,663.7 10,648.2 Less treasury stock, at cost, and deferred compensation Total common stockholders' investment Source: FedEx Company Filings. *Note: Financial results for 1997 and subsequent years are consolidated to include the acquisition of Caliber System Inc. The accompanying Notes to Consolidated Financial Statements are an integral part of these balance sheets. Exhibit 7 UPS Financial Statements, 19941999 Statement of Income (year-ended December 31) Nine Months Ended September 30, 1998 Nine Months Ended September 30, 1999 (Financial data in millions, except per share amounts) 1994 1995 1996 1997 1998 20,650 16,943 2,346 287 19,576 17.773 2,886 386 21,045 18,881 2,989 498 22,368 18,868 2,934 656 22,458 3,237 901 24,788 15,129 2,342 653 18,124 16,239 2,562 805 19,606 11,727 6,293 13,326 7,013 13,289 7,461 14,346 7,352 12,401 6,478 372 19,251 10.587 5,315 11,226 5,522 18,020 20,339 20,760 21,698 15,902 16,748 1,821 (390) 125 1,937 (250) 107 2,181 (281) 129 1,654 (67) 111 2,899 56 135 2,098 19 105 REVENUE U.S. domestic package International package Non-package TOTAL REVENUES Operating expenses: Compensation and benefits Other Restructuring charge TOTA TOTAL OPERATING EXPENSES 0 OPERATING PROFIT (LOSS) U.S. domestic package International package Non-package Corporate TOTAL OPERATING PROFIT Other income (expense): Investment income Interest expense Tax assessment Miscellaneous, net INCOME BEFORE INCOME TAXES Income taxes NET INCOME Per share amounts: Basic earnings per share Diluted earnings per share Dividends declared per share Net income before impact of tax assessment As a percentage of revenue 2,522 147 85 104 2,858 - 1,556 1,794 2,029 1,698 3,090 2,222 13 (29) 26 (77) 39 (95) 70 (187) 84 (227) 56 (169) 35 1,575 632 943 (35) 1,708 665 1,043 (63) 1,910 764 1,146 (28) 1,553 644 909 (45) 2.902 1,161 1.741 (3) 2,106 847 1.259 115 (170) (1,786) (30) 987 765 222 0.84 0.82 0.93 0.92 0.32 1.03 1.01 0.34 0.82 0.81 0.35 1.59 1.57 0.43 1.16 1.14 0.20 0.20 0.20 0.28 0.28 943 4.8% 1,043 5.0% 1,146 5.1% 909 4.0% 1,741 7.0% 1,259 7.0% 1,664 8.5% Source: UPS Company Filings. Exhibit 7 (continued) 1997 1998 460 BALANCE SHEET United Parcel Service In millions, except where noted. As of December 31, ASSETS CURRENT ASSETS Cash and cash equivalents Marketable securities and short-term investments Accounts receivable Prepaid employee benefit costs Materials, supplies and other prepaid expenses Common stock held for stock plans Total Current Assets PROPERTY, PLANT, AND EQUIPMENT Vehicles Aircraft (including aircraft under capitalized leases) Land Buildings Leasehold improvements Plant equipment Construction-in-progress 2,405 669 417 526 4,477 1,240 389 2,713 703 380 5,425 3,519 6,771 654 1,433 1,734 4,063 328 18,502 7,495 11,007 428 15,912 3,482 7,739 651 1,478 1,803 4,144 257 19,554 8,170 11,384 258 17,067 Less accumulated depreciation and amortization Net Property, Plant, and Equipment Other Assets TOTAL ASSETS 1,322 1,092 247 1,207 1,194 191 140 41 625 3,398 2.583 LIABILITIES AND SHAREOWNERS' EQUITY CURRENT LIABILITIES Accounts payable Accrued wages and withholdings Dividends payable Deferred income taxes Current maturities of long-term debt Other current liabilities Total Current Liabilities Long-Term Debt (including capitalized lease obligations) Accumulated Postretirement Benefit Obligation Deferred Taxes, Credits and Other Liabilities SHAREOWNERS' EQUITY Preferred stock, no par value, authorized 200,000,000 shares, none issued Class A common stock, par value $.01 per share, authorized 4,600,000,000 shares, issued 1,101,295,534 and 1,118,000,000 in 1999 and 1998 Class B common stock, par value $.01 per share, authorized 5,600,000,000 shares, issued 109,400,000 and -- in 1999 and 1998 Additional paid-in capital Retained earnings Accumulated other comprehensive loss Unrealized loss on marketable securities 410 646 3,717 2,191 969 3,017 911 2,933 - - 56 11 6,112 (81) 325 7,325 (63) 6,087 Treasury stock, at cost (-0- and 23, 211,904 shares in 1997 and 1998) 7,598 (425) 7,173 17,067 6,087 15,912 TOTAL LIABILITIES AND SHAREOWNERS' EQUITY Source: UPS Company Filings. Exhibit 7 (continued) Financial Data in Millions: Year Ended December 31 6 Months Ended Balance Sheet Data (at end of period): Working Capital Long-term debt Total assets Shareowner's equity 1994 $ 120 $ 1,127 $11,182 $ 4,647 1995 $ 261 $ 1,729 $12,645 $ 5,151 1996 $ 1,097 $ 2,573 $14,954 $ 5,901 1997 $ 1,079 $ 2,583 $15,912 $ 6,087 1998 $ 1,708 $ 2,191 $17,067 $ 7,173 June 30, 1999 $ 434 $ 2,138 $18,302 $ 6,122 Source: UPS Company Filings. Exhibit 6 FedEx Stock Price Performance and Valuation Multiples FDX Dails - 10/29/99 65 60 55 50 45 40 35 30 25 20 15 Volume - BigCharts.com 30 20 Millions 0 D 97 F M A M J J A S O N D 98 F M A M J J A S O N D 99 F M A M J J A S O Source: BigCharts.com. Market Data and Multiples(November 1, 1999) Shares outstanding (weighted average, diluted) Share price Price/Earningsa Price/Total revenueb Market/Book value Equity Betad 300.6 million $41.50 19.8 0.74 2.68 1.16 Source: FedEx company filings. a Total market capitalization/Net income. bTotal market capitalization/Total revenue. Total market capitalization/Shareholders' equity. dSalomon Smith Barney Equity Research report on FedEx, June 22, 1999. Exhibit 8 FedEx Financial Statements, 1996-1999 CONSOLIDATED STATEMENTS OF INCOME FDX Corporation 1996 $ 10,273,619 1997* $ 14,237,892 1998 1999 $ 15,872,810 $ 16,773,470 Years ended May 31 In thousands, except Earnings Per Share REVENUES OPERATING EXPENSES: Salaries and employee benefits Purchased transportation Rentals and landing fees Depreciation and amortization Maintenance and repairs Fuel Merger expenses Restructuring and impairment charges (credits) Other 4,619,990 370,650 959,055 719,609 617,657 578,614 6,150,247 1,252,901 1,138,690 928,833 773,765 734,722 6,647,140 1,481,590 1,304,296 963,732 874,400 726,776 88,000 (16,000) 2,792,216 14,862,150 1,010,660 7,087,728 1,537,785 1,396,694 1,035,118 958,873 604,929 1,784,220 9,649,795 623,824 225,036 2,526,696 13,730,890 507,002 2,989,257 15,610,384 1,163,086 OPERATING INCOME OTHER INCOME (EXPENSE): Interest, net Other, net (95,599) 11,734 (83,865) (104,195) 23,058 (81,137) (124,413) 13,271 (111,142) (98,191) (3,831) (102,022) 539,959 232,182 307,777 425,865 229,761 196,104 899,518 401,363 498,155 1,061,064 429,731 631,333 INCOME FROM CONTINUING OPERATIONS BEFORE INCOME TAXES PROVISION FOR INCOME TAXES INCOME FROM CONTINUING OPERATIONS INCOME FROM DISCONTINUED OPERATIONS, NET OF INCOME TAXES NET INCOME EARNINGS PER COMMON SHARE Continuing operations Discontinued operations 4,875 503,030 $ $ 307,777 $ 196,104 S 631,333 $ 2.69 $ .67 S 2.13 1.70 $ .02 1.72 $ $ 2.69 $ .67 $ 2.13 EARNINGS PER COMMON SHARE, ASSUMING DILUTION Continuing operations Discontinued operations $ 2.69 $ .67 $ 2.10 1.67 $ .02 1.69 $ $ 2.69 $ .67 $ 2.10 Source: FedEx Company Filings. *Financial results for 1997 and subsequent years are consolidated to include the acquisition of Caliber System Inc. Exhibit 8 (continued) FedEx Corporation CONSOLIDATED BALANCE SHEETS FDX Corporation 1995 1996 1997 1998 1999 May 31 In millions ASSETS CURRENT ASSETS Cash and cash equivalents Receivables, less allowances Spare parts, supplies and fuel Deferred income taxes Prepaid expenses and other Total current assets PROPERTY AND EQUIPMENT, AT COST Flight equipment Package handling and ground support equipment and vehicles Computer and electronic equipment Other 357.6 1,130.3 1933 115.8 72.2 1,869.1 93.5 1,271.6 222.1 92.6 48.5 1,728,3 160.9 1,878.0 339.4 197.0 68.6 2,643.7 229,6 1,943.4 364.7 232.8 109.6 2.880.1 325.3 2,153.2 291.9 290.7 79.9 3,141.0 3,006.7 1,841.1 1,224.0 1,625.9 7,697.7 3,982.5 3.715.2 3,372.6 2.148.5 1,4399 1,717.5 8,678.5 4,561.9 4,116.6 3,741.4 3,1311 1,9579 2,557.6 11,387.9 5,917.5 5,470.4 4,056.5 3,425.3 2.162.6 2,819.4 12,463.9 6,528.8 5,935.1 4,556.7 3,858.8 2,363.6 2.940.7 13,719.9 7,160.7 6,5592 Less accumulated depreciation and amortization Net property and equipment OTHER ASSETS Goodwill Equipment deposits and other assets Total other assets 397.3 451.8 849.0 6,433.4 380.7 473.4 854.1 6,699.0 370.3 559.8 930.2 9,044.3 356.3 514.6 870.9 9,686.1 344.0 604.0 948.0 10,648.2 255.4 618.6 904.5 8.0 705.5 904.9 356.7 999.8 1,223.0 257.5 1.145.4 1,400.9 LIABILITIES AND STOCKHOLDERS' INVESTMENT CURRENT LIABILITIES Current portion of long-term debt Accounts payable Accrued expenses Other Liabilities Total current liabilities LONG-TERM DEBT, LESS CURRENT PORTION DEFERRED INCOME TAXES OTHER LIABILITIES COMMITMENTS AND CONTINGENCIES (NOTES 5, 13 and 14) COMMON STOCKHOLDERS' INVESTMENT Common Stock, $.10 par value Additional paid-in capital Retained earnings Accumulated other comprehensive income 14.9 1.134.0 895.4 740.5 2,784.8 1,359.7 293.5 1,546.6 1,778.5 1.324.7 56.0 1,028.6 1,618.4 1.325.3 64.0 1.115.1 2,579.5 1,598,0 181.8 1,183.9 2,803.8 1,385.2 274.1 1,261.7 5.7 5.6 775.3 1,466.4 0.0 2,247.3 1.7 2.245.6 6,433.4 815.1 1,766.6 0.0 2,587.4 11.3 2,576.1 6,699.0 14.8 938.0 2,621.5 0.0 3,574.3 73.1 3,501.2 9,044.3 14.7 992.8 2,999.4 (27.3) 3,979.6 18.4 3,961.2 9,686.1 29.8 1,061.3 3,615.8 (24.7) 4,682.2 18.5 4,663.7 10,648.2 Less treasury stock, at cost, and deferred compensation Total common stockholders' investment Source: FedEx Company Filings. *Note: Financial results for 1997 and subsequent years are consolidated to include the acquisition of Caliber System Inc. The accompanying Notes to Consolidated Financial Statements are an integral part of these balance sheets


