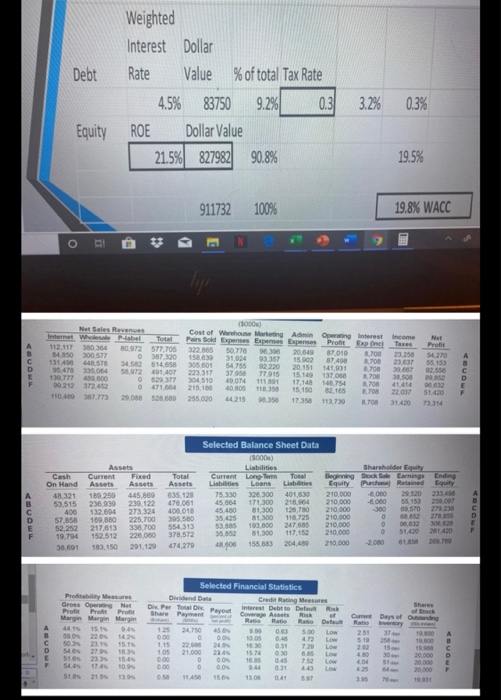
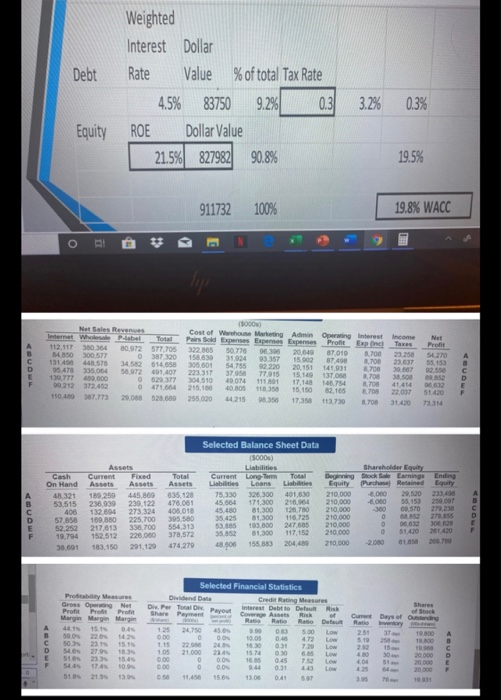
What is WACC for company F? ROE is 21.8%
Use the format on picture 1.(Numbers in the template is just an example. Do not use those numbers)

Debt Weighted Interest Dollar Rate Value % of total Tax Rate 4.5% 83750 9.2% 0.3 ROE Dollar Value 21.5% 827982 90.8% 3.2% 0.3% Equity 19.5% 911732 100% 19.8% WACC Profit 000) Net Sales Revenge Cost of Warhouse Marketing A n Operating interest income Internet Wholesale Palabal Total Pairs Sold Expenses Expenses Expenses ProntExpl omas 112,117 380384 0972 577 705 322 65 50 778 0 2 06407010 84 0 01577 0 387300 158.830 31.924 03357 3708 578 34 5 14858 306 601 54755 92 220 305.064 58.972 01.407223 317 37 958 77.915 15.149 137 OSB 450,000 0 522377 304510 ON 111 801 17.148 66754 90 212 372.452 0 471.664 215,150 10.805 18.358 82.165 708 2207 10.450 387.773 29.088 528.689 255.000 4.215 8.35617358 13.730 e 31.420 51 420 733 Selected Balance Sheet Data On Hand Long Term Loans 326 300 Total Liabilities 401,630 Beginning Equity Current Liabilities 75 330 45.864 45.480 Current Fixed Assets Assets 189259445.809 238.939 239.122 132.604 273,324 169 880225.700 217 813 336 700 152.512 225.000 133 150 291,120 Total Assets 835.128 478.081 408.018 305 580 554,313 378,572 474,279 53.515 406 57.858 52 252 19.794 38 601 Shareholder Equity och Earnings Ending Path Retained Equity 8.000 29,520 233,498 000 53.153 259 097 300 00.570 273,238 0 68.852278655 0.632 300.000 0 51.420 251420 2080 81858 27 D 53.835 35 852 48.606 81300 193,500 81,300 155.583 110.725 247 68 117.152 204489 210,000 210.000 210.000 210.000 Proy Measures Gross Opong Net P Margin Margin Margin Selected Financial Statistics Dividend Data Credit Racing Measures a l Payout 1.15 22.0 20 52500 544 174 09 51. 8 215 13 14 15.0 13.08 0.41 Debt Weighted Interest Dollar Rate Value % of total Tax Rate 4.5% 83750 9.2% 0.3 ROE Dollar Value 21.5% 827982 90.8% 3.2% 0.3% Equity 19.5% 911732 100% 19.8% WACC Profit 000) Net Sales Revenge Cost of Warhouse Marketing A n Operating interest income Internet Wholesale Palabal Total Pairs Sold Expenses Expenses Expenses ProntExpl omas 112,117 380384 0972 577 705 322 65 50 778 0 2 06407010 84 0 01577 0 387300 158.830 31.924 03357 3708 578 34 5 14858 306 601 54755 92 220 305.064 58.972 01.407223 317 37 958 77.915 15.149 137 OSB 450,000 0 522377 304510 ON 111 801 17.148 66754 90 212 372.452 0 471.664 215,150 10.805 18.358 82.165 708 2207 10.450 387.773 29.088 528.689 255.000 4.215 8.35617358 13.730 e 31.420 51 420 733 Selected Balance Sheet Data On Hand Long Term Loans 326 300 Total Liabilities 401,630 Beginning Equity Current Liabilities 75 330 45.864 45.480 Current Fixed Assets Assets 189259445.809 238.939 239.122 132.604 273,324 169 880225.700 217 813 336 700 152.512 225.000 133 150 291,120 Total Assets 835.128 478.081 408.018 305 580 554,313 378,572 474,279 53.515 406 57.858 52 252 19.794 38 601 Shareholder Equity och Earnings Ending Path Retained Equity 8.000 29,520 233,498 000 53.153 259 097 300 00.570 273,238 0 68.852278655 0.632 300.000 0 51.420 251420 2080 81858 27 D 53.835 35 852 48.606 81300 193,500 81,300 155.583 110.725 247 68 117.152 204489 210,000 210.000 210.000 210.000 Proy Measures Gross Opong Net P Margin Margin Margin Selected Financial Statistics Dividend Data Credit Racing Measures a l Payout 1.15 22.0 20 52500 544 174 09 51. 8 215 13 14 15.0 13.08 0.41


