

Answered step by step
Verified Expert Solution
Question
1 Approved Answer
What is What is costs of equity using the CAPM, the dividend discount model, and the earnings capitalization ratio? What is the stock worth? 1996
What is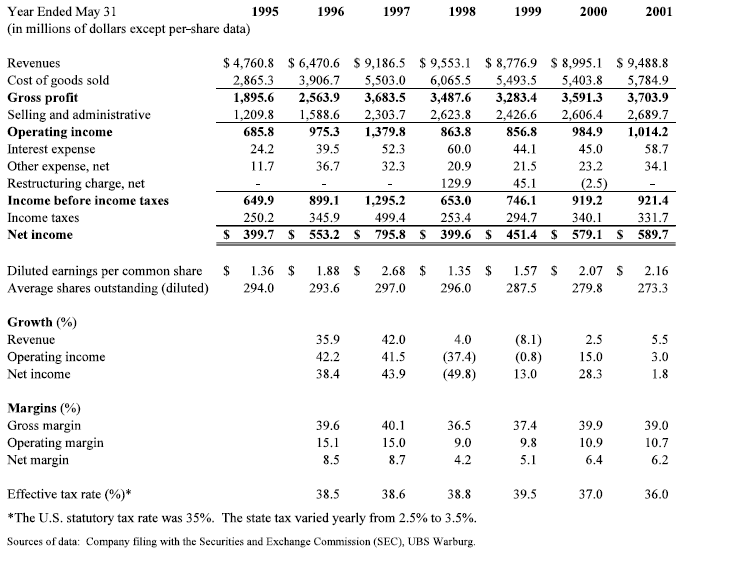
What is costs of equity using the CAPM, the dividend discount model, and the earnings capitalization ratio?
What is the stock worth?
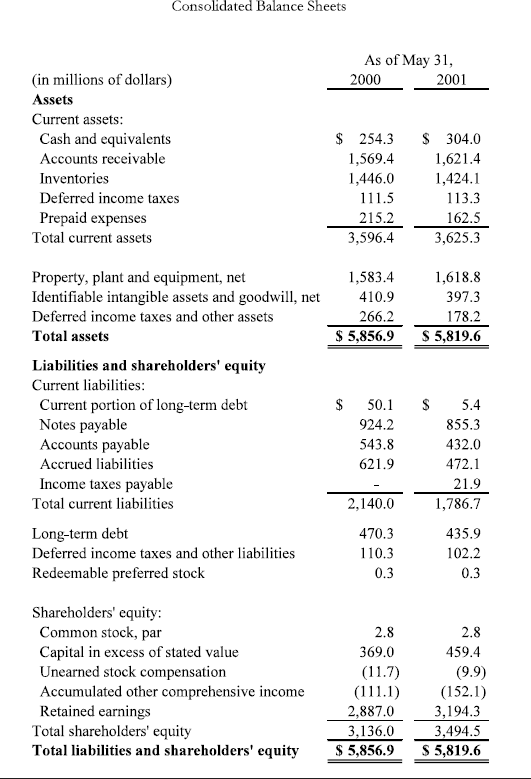
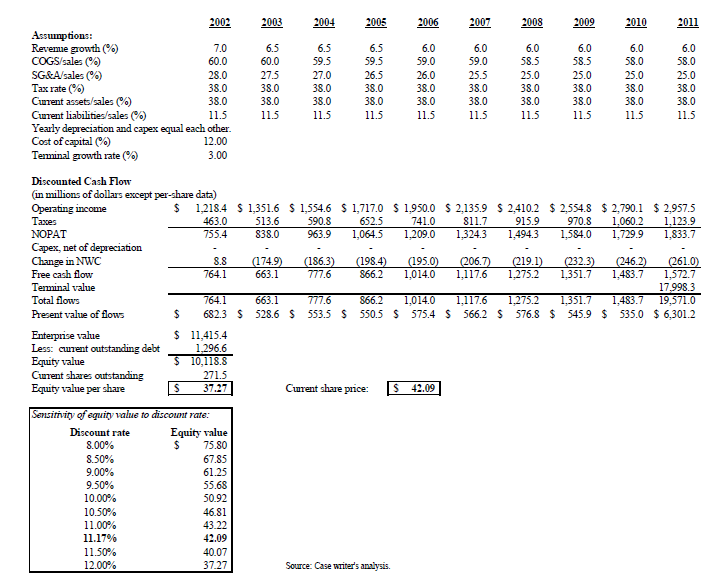
1996 1997 1998 1999 2000 2001 Year Ended May 31 1995 (in millions of dollars except per-share data) Revenues Cost of goods sold Gross profit Selling and administrative Operating income Interest expense Other expense, net Restructuring charge, net Income before income taxes Income taxes Net income $ 4,760.8 $ 6,470.6 $9,186.5 $ 9,553.1 $ 8,776.9 $ 8,995.1 $ 9,488.8 2,865.3 3,906.7 5,503.0 6,065.5 5,493.5 5,403.8 5,784.9 1,895.6 2,563.9 3,683.5 3,487.6 3,283.4 3,591.3 3,703.9 1,209.8 1,588.6 2,303.7 2,623.8 2,426.6 2,606.4 2,689.7 685.8 975.3 1,379.8 863.8 856.8 984.9 1,014.2 24.2 39.5 52.3 60.0 44.1 45.0 58.7 11.7 36.7 32.3 20.9 21.5 23.2 34.1 129.9 45.1 (2.5) 649.9 899.1 1,295.2 653.0 746.1 919.2 921.4 250.2 345.9 499.4 253.4 294.7 340.1 331.7 $ 399.7 $ 553.2 s 795.8 S 399.6 $ 451.4 $ 579.1 $ 589.7 $ Diluted earnings per common share Average shares outstanding (diluted) 1.36 $ 294.0 1.88 $ 293.6 2.68 $ 297.0 1.35 $ 296.0 1.57 287.5 2.07 $ 279.8 2.16 273.3 Growth %) Revenue Operating income Net income 35.9 42.2 38.4 42.0 41.5 43.9 4.0 (37.4) (49.8) (8.1) (0.8) 13.0 2.5 15.0 28.3 5.5 3.0 1.8 Margins (%) Gross margin Operating margin Net margin 39.6 15.1 40.1 15.0 36.5 9.0 4.2 37.4 9.8 5.1 39.9 10.9 6.4 39.0 10.7 6.2 8.5 8.7 39.5 37.0 36.0 Effective tax rate (%)* 38.5 38.6 38.8 *The U.S. statutory tax rate was 35%. The state tax varied yearly from 2.5% to 3.5%. Sources of data: Company filing with the Securities and Exchange Commission (SEC), UBS Warburg, Consolidated Balance Sheets As of May 31, 2000 2001 (in millions of dollars) Assets Current assets: Cash and equivalents Accounts receivable Inventories Deferred income taxes Prepaid expenses Total current assets $ 254.3 1,569.4 1,446.0 111.5 215.2 3,596.4 $ 304.0 1,621.4 1,424.1 113.3 162.5 3,625.3 1,583.4 410.9 266.2 $ 5,856.9 1,618.8 397.3 178.2 $ 5,819.6 $ S Property, plant and equipment, net Identifiable intangible assets and goodwill, net Deferred income taxes and other assets Total assets Liabilities and shareholders' equity Current liabilities: Current portion of long-term debt Notes payable Accounts payable Accrued liabilities Income taxes payable Total current liabilities Long-term debt Deferred income taxes and other liabilities Redeemable preferred stock 50.1 924.2 543.8 621.9 5.4 855.3 432.0 472.1 21.9 1,786.7 2,140.0 470.3 110.3 0.3 435.9 102.2 0.3 Shareholders' equity: Common stock, par Capital in excess of stated value Unearned stock compensation Accumulated other comprehensive income Retained earnings Total shareholders' equity Total liabilities and shareholders' equity 2.8 369.0 (11.7) (111.1) 2,887.0 3,136.0 $ 5,856.9 2.8 459.4 (9.9) (152.1) 3,194.3 3,494.5 S 5,819.6 2003 2004 2005 2006 2007 2008 2009 2010 2011 2002 Assumptions: Reverie prowth () 7.0 COGS/sales (%) 60.0 SG&A/sales (%) 28.0 Tax rate() 38.0 Curent assets/sales (%) 38.0 Curent liabilities/sales (%) 11.5 Yearly depreciation and capex equal each other. Cost of capital (%) 12.00 Terminal growth rate 3.00 6.5 60.0 27.5 38.0 38.0 11.5 6.5 59.5 27.0 38.0 38.0 11.5 6.5 59.5 26.5 38.0 38.0 11.5 6.0 59.0 26.0 38.0 38.0 11.5 6.0 59.0 25.5 38.0 6.0 58.5 25.0 38.0 6.0 58.5 25.0 38.0 380 11.5 6.0 580 25.0 38.0 38.0 11.5 6.0 58.0 25.0 38.0 38.0 11.5 38.0 38.0 11.5 11.5 Discounted Cash Flow (in millions of dollars except per-share data) Operating income $ 1,218.4 S 1,351.6 $ 1,554.6 $ 1,717,0 $ 1.950.0 $ 2.135.9 $ 2,410.2 $ 2.554.8 $ 2,790.1 $ 2.957.5 Taxes 463.0 513.6 590.8 652.5 741.0 811.7 915.9 970.8 1.060.2 1.123.9 NOPAT 755.4 838.0 963.9 1,064.5 1.209.0 1.324.3 1.494.3 1,584.0 1,729.9 1.833.7 Capex, net of depreciation Change in NWC 8.8 (174.9) (186.3) (198.4) (195.0) (206.7) (219.1) (2323) (246.2) (261.0) Free cash flow 764.1 663.1 777.6 866.2 1,014.0 1.117.6 1.275.2 1,351.7 1,483.7 1.572.7 Terminal value 17.998.3 Total flows 764.1 663.1 777.6 866.2 1.014.0 1.117.6 1.275.2 1.351.7 1.483.7 19.571.0 Present value of flows $ 6823 $ 528.6 $ 553.5 $ 550.5 $ 575.4 $ 566.2 $ 576.8 $ 545.9 $ 535.0 $ 6,301.2 Enterprise value $ 11,415.4 Less: curent outstanding debt 1,296.6 Equity value $ 10,118.8 Current shares outstanding 271.5 Equuty value per share $ 37.27 Curent share price: $ 42.09 Sensitivity of equity value to discount rate: Discount rate Equity value 8.00% $ 75.80 8.50% 67.85 9.00% 61.25 9.50% 55.68 10.00% 50.92 10.50% 46.81 11.00% 43.22 11.17% 42.09 11.50% 40.07 12.00% 37.27 Source: Case writer's analysis. 1996 1997 1998 1999 2000 2001 Year Ended May 31 1995 (in millions of dollars except per-share data) Revenues Cost of goods sold Gross profit Selling and administrative Operating income Interest expense Other expense, net Restructuring charge, net Income before income taxes Income taxes Net income $ 4,760.8 $ 6,470.6 $9,186.5 $ 9,553.1 $ 8,776.9 $ 8,995.1 $ 9,488.8 2,865.3 3,906.7 5,503.0 6,065.5 5,493.5 5,403.8 5,784.9 1,895.6 2,563.9 3,683.5 3,487.6 3,283.4 3,591.3 3,703.9 1,209.8 1,588.6 2,303.7 2,623.8 2,426.6 2,606.4 2,689.7 685.8 975.3 1,379.8 863.8 856.8 984.9 1,014.2 24.2 39.5 52.3 60.0 44.1 45.0 58.7 11.7 36.7 32.3 20.9 21.5 23.2 34.1 129.9 45.1 (2.5) 649.9 899.1 1,295.2 653.0 746.1 919.2 921.4 250.2 345.9 499.4 253.4 294.7 340.1 331.7 $ 399.7 $ 553.2 s 795.8 S 399.6 $ 451.4 $ 579.1 $ 589.7 $ Diluted earnings per common share Average shares outstanding (diluted) 1.36 $ 294.0 1.88 $ 293.6 2.68 $ 297.0 1.35 $ 296.0 1.57 287.5 2.07 $ 279.8 2.16 273.3 Growth %) Revenue Operating income Net income 35.9 42.2 38.4 42.0 41.5 43.9 4.0 (37.4) (49.8) (8.1) (0.8) 13.0 2.5 15.0 28.3 5.5 3.0 1.8 Margins (%) Gross margin Operating margin Net margin 39.6 15.1 40.1 15.0 36.5 9.0 4.2 37.4 9.8 5.1 39.9 10.9 6.4 39.0 10.7 6.2 8.5 8.7 39.5 37.0 36.0 Effective tax rate (%)* 38.5 38.6 38.8 *The U.S. statutory tax rate was 35%. The state tax varied yearly from 2.5% to 3.5%. Sources of data: Company filing with the Securities and Exchange Commission (SEC), UBS Warburg, Consolidated Balance Sheets As of May 31, 2000 2001 (in millions of dollars) Assets Current assets: Cash and equivalents Accounts receivable Inventories Deferred income taxes Prepaid expenses Total current assets $ 254.3 1,569.4 1,446.0 111.5 215.2 3,596.4 $ 304.0 1,621.4 1,424.1 113.3 162.5 3,625.3 1,583.4 410.9 266.2 $ 5,856.9 1,618.8 397.3 178.2 $ 5,819.6 $ S Property, plant and equipment, net Identifiable intangible assets and goodwill, net Deferred income taxes and other assets Total assets Liabilities and shareholders' equity Current liabilities: Current portion of long-term debt Notes payable Accounts payable Accrued liabilities Income taxes payable Total current liabilities Long-term debt Deferred income taxes and other liabilities Redeemable preferred stock 50.1 924.2 543.8 621.9 5.4 855.3 432.0 472.1 21.9 1,786.7 2,140.0 470.3 110.3 0.3 435.9 102.2 0.3 Shareholders' equity: Common stock, par Capital in excess of stated value Unearned stock compensation Accumulated other comprehensive income Retained earnings Total shareholders' equity Total liabilities and shareholders' equity 2.8 369.0 (11.7) (111.1) 2,887.0 3,136.0 $ 5,856.9 2.8 459.4 (9.9) (152.1) 3,194.3 3,494.5 S 5,819.6 2003 2004 2005 2006 2007 2008 2009 2010 2011 2002 Assumptions: Reverie prowth () 7.0 COGS/sales (%) 60.0 SG&A/sales (%) 28.0 Tax rate() 38.0 Curent assets/sales (%) 38.0 Curent liabilities/sales (%) 11.5 Yearly depreciation and capex equal each other. Cost of capital (%) 12.00 Terminal growth rate 3.00 6.5 60.0 27.5 38.0 38.0 11.5 6.5 59.5 27.0 38.0 38.0 11.5 6.5 59.5 26.5 38.0 38.0 11.5 6.0 59.0 26.0 38.0 38.0 11.5 6.0 59.0 25.5 38.0 6.0 58.5 25.0 38.0 6.0 58.5 25.0 38.0 380 11.5 6.0 580 25.0 38.0 38.0 11.5 6.0 58.0 25.0 38.0 38.0 11.5 38.0 38.0 11.5 11.5 Discounted Cash Flow (in millions of dollars except per-share data) Operating income $ 1,218.4 S 1,351.6 $ 1,554.6 $ 1,717,0 $ 1.950.0 $ 2.135.9 $ 2,410.2 $ 2.554.8 $ 2,790.1 $ 2.957.5 Taxes 463.0 513.6 590.8 652.5 741.0 811.7 915.9 970.8 1.060.2 1.123.9 NOPAT 755.4 838.0 963.9 1,064.5 1.209.0 1.324.3 1.494.3 1,584.0 1,729.9 1.833.7 Capex, net of depreciation Change in NWC 8.8 (174.9) (186.3) (198.4) (195.0) (206.7) (219.1) (2323) (246.2) (261.0) Free cash flow 764.1 663.1 777.6 866.2 1,014.0 1.117.6 1.275.2 1,351.7 1,483.7 1.572.7 Terminal value 17.998.3 Total flows 764.1 663.1 777.6 866.2 1.014.0 1.117.6 1.275.2 1.351.7 1.483.7 19.571.0 Present value of flows $ 6823 $ 528.6 $ 553.5 $ 550.5 $ 575.4 $ 566.2 $ 576.8 $ 545.9 $ 535.0 $ 6,301.2 Enterprise value $ 11,415.4 Less: curent outstanding debt 1,296.6 Equity value $ 10,118.8 Current shares outstanding 271.5 Equuty value per share $ 37.27 Curent share price: $ 42.09 Sensitivity of equity value to discount rate: Discount rate Equity value 8.00% $ 75.80 8.50% 67.85 9.00% 61.25 9.50% 55.68 10.00% 50.92 10.50% 46.81 11.00% 43.22 11.17% 42.09 11.50% 40.07 12.00% 37.27 Source: Case writer's analysis
Step by Step Solution
There are 3 Steps involved in it
Step: 1

Get Instant Access to Expert-Tailored Solutions
See step-by-step solutions with expert insights and AI powered tools for academic success
Step: 2

Step: 3
Ace Your Homework with AI
Get the answers you need in no time with our AI-driven, step-by-step assistance
Get Started
Essays In Public Finance Theory And Practice Of Decentralization Essays In Public Finance
Authors: Tikiri Herath
1st Edition
3659130532, 9783659130533