What is your appraisal of Netflixs operating and financial performance based on the data in case Exhibits 1, 2, 5, 6, and 7? What positives and negatives do you see in Netflixs performance? Use the financial ratios in Table 4.1 of Chapter 4 as a guide in doing the calculations needed to arrive at an analysis-based answer to your assessment of Netflixs recent financial performance.
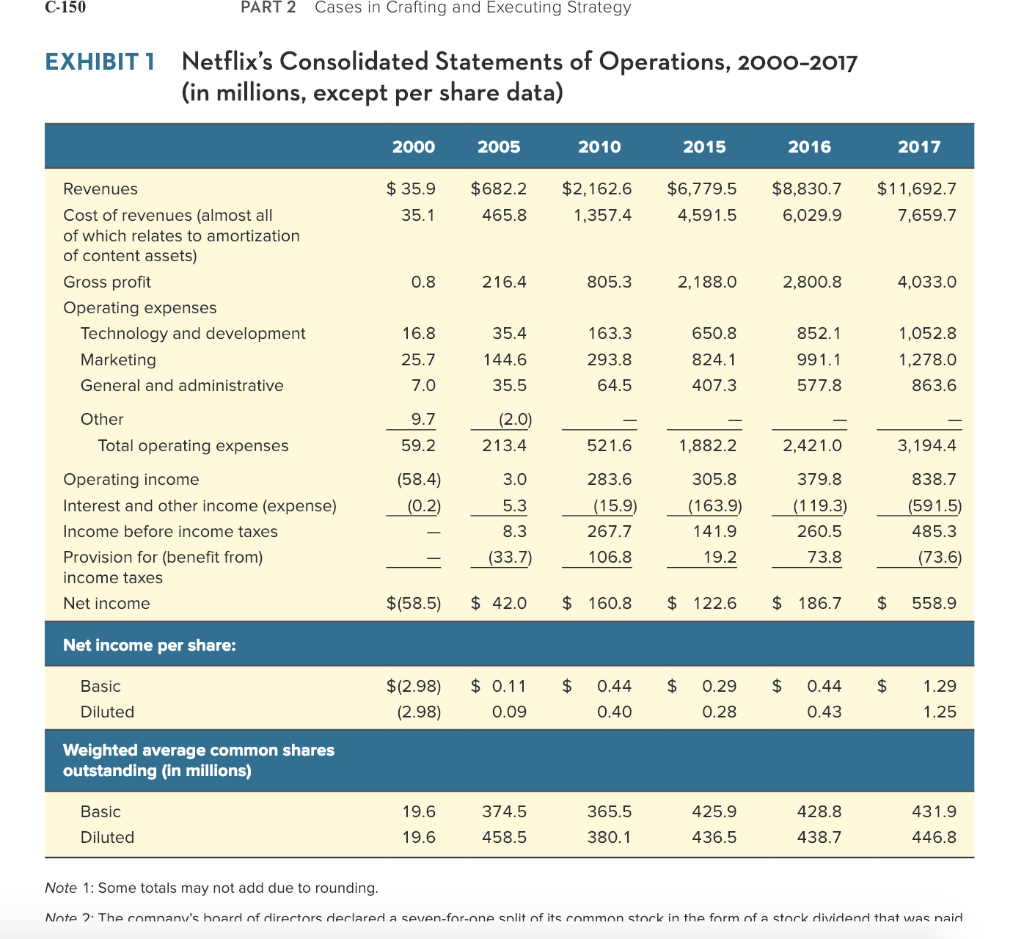
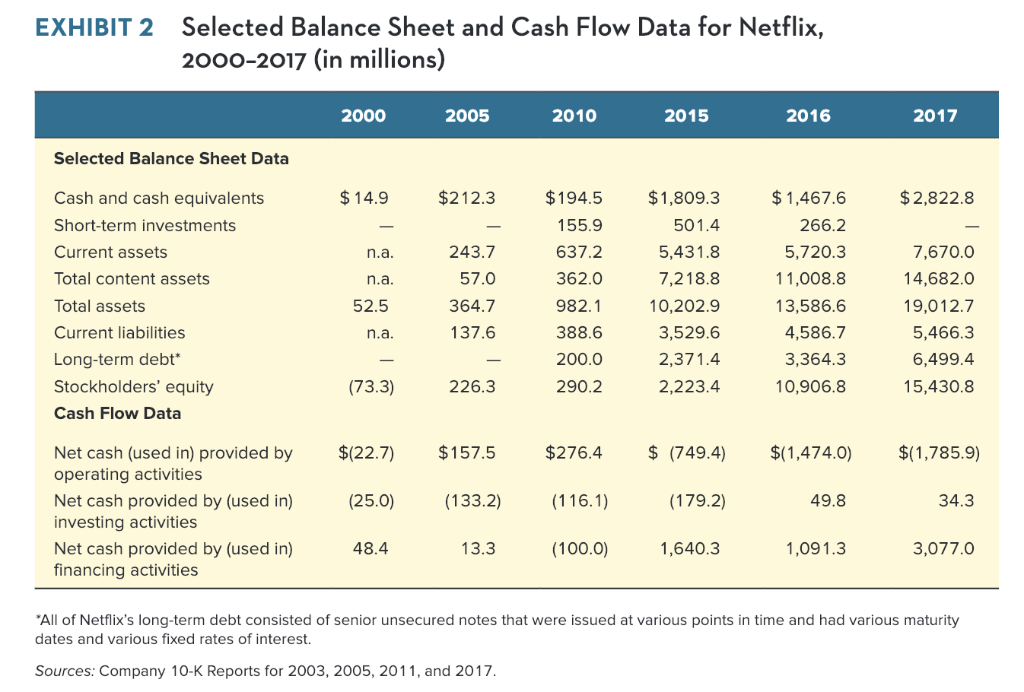
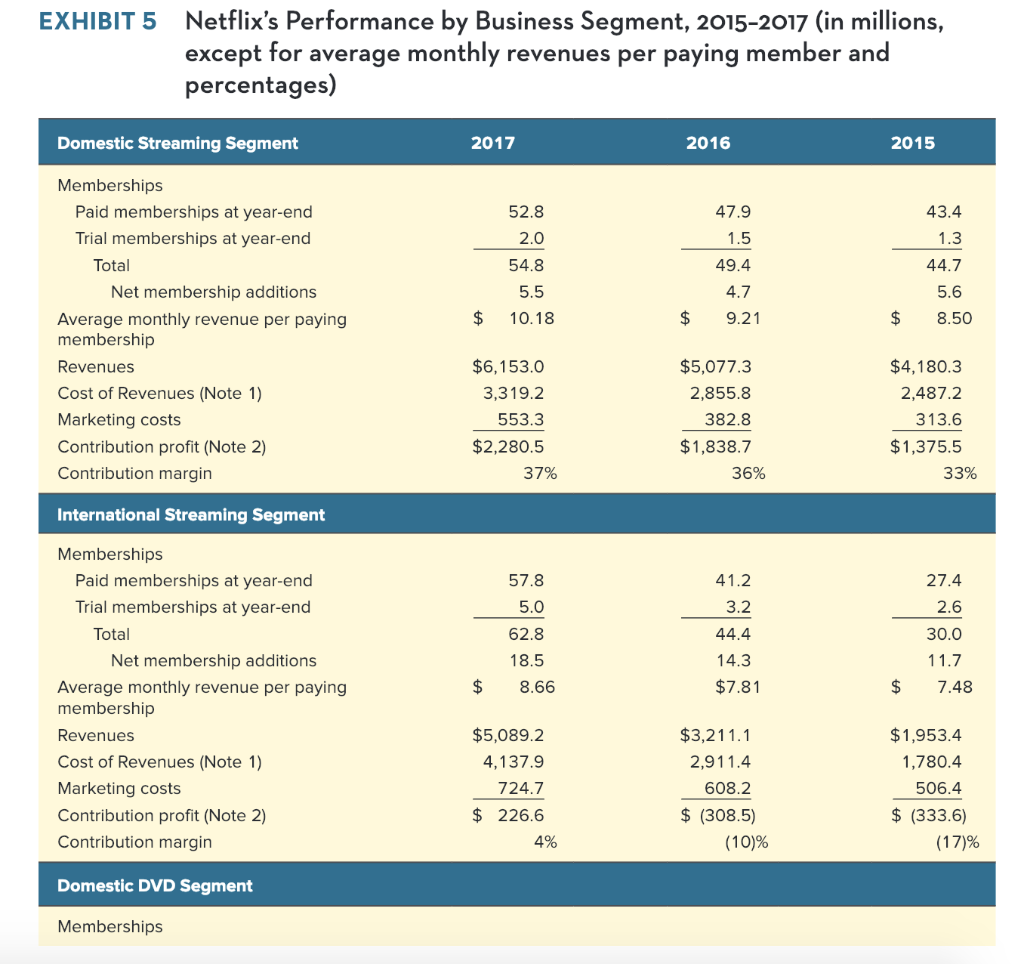
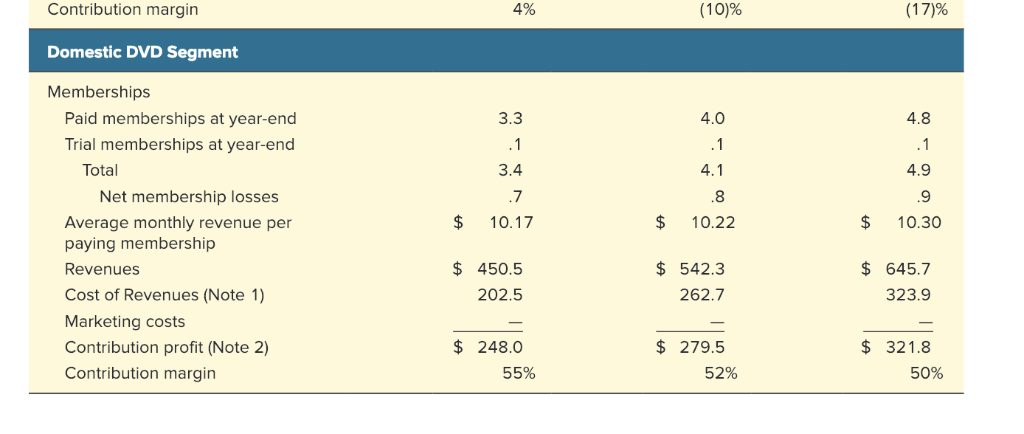
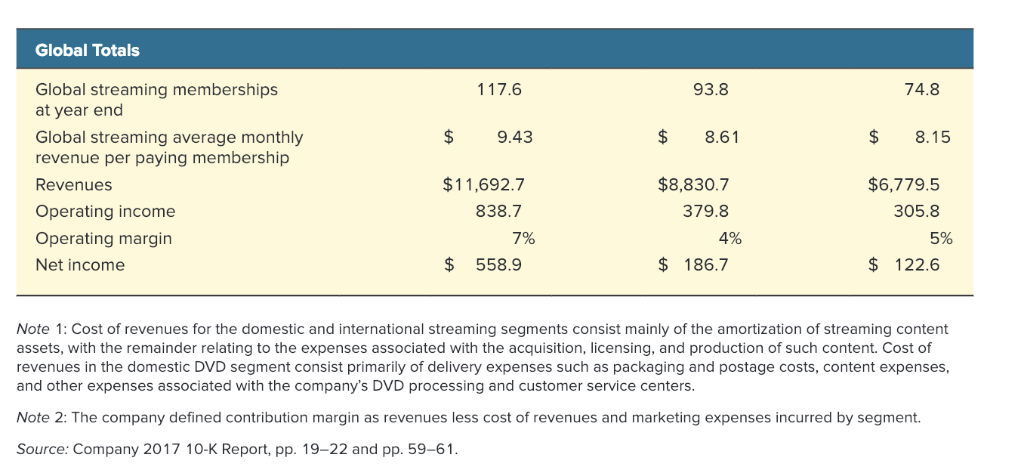
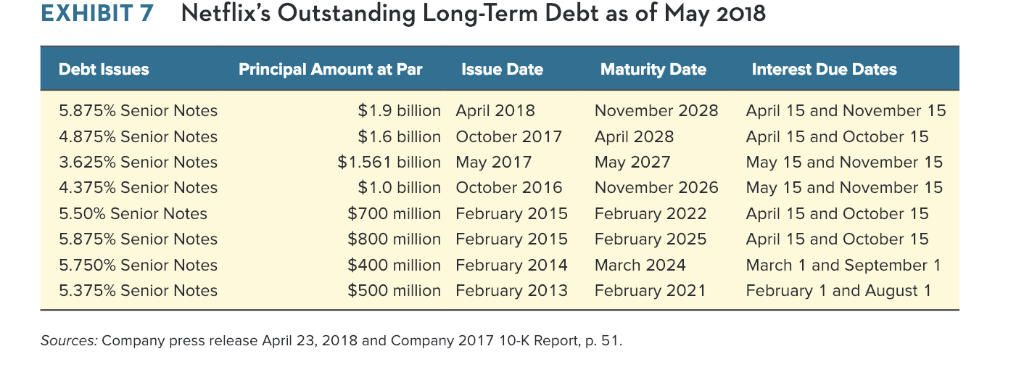
C-150 PART 2 Cases in Crafting and Executing Strategy Netflix's Consolidated Statements of Operations, 2000-2017 (in millions, except per share data) EXHIBIT 1 2000 2005 2010 2015 2016 2017 $35.9 $682.2 $2,162.6 $6,779.5 $8,830.7$11,692.7 Revenues Cost of revenues (almost all of which relates to amortization of content assets) Gross profit Operating expenses 465.8 1,357.4 4,591.5 6,029.9 7,659.7 216.4 805.3 2,188.0 2,800.8 4,033.0 Technology and development Marketing General and administrative Other 852.1 991.1 577.8 16.8 35.4 144.6 35.5 (2.0) 213.4 163.3 293.8 64.5 650.8 824.1 407.3 1,052.8 1,278.0 863.6 25.7 Total operating expenses 59.2 521.6 1,882.2 2,421.0 Operating income Interest and other income (expense)(0.2) Income before income taxes Provision for (benefit from) income taxes Net income 379.8 5.3(15.9)(163.9) (119.3) 260.5 73.8 3,194.4 838.7 591.5 485.3 283.6 305.8 267.7 (33.7) 106.8 $(58.5) 42.0 160.8 122.6 $ 186.7558.9 Net income per share: $(2.98) Basic Diluted 0.11 0.44 $ 0.29$ 0.441.29 0.09 0.28 0.43 Weighted average common shares outstanding (in millions) 19.6 374.5 458.5 365.5 380.1 425.9 436.5 428.8 438.7 431.9 Diluted 19.6 446.8 Note 1: Some totals may not add due to rounding Note . The rnmnanv's hnard of dirertors derlared a seven-for-one snlit of its common stock in the form of a stork dividdend that was naidl Selected Balance Sheet and Cash Flow Data for Netflix, 2000-2017 (in millions) EXHIBIT 2 2000 2005 2010 2015 2016 2017 Selected Balance Sheet Data $1,467.6 266.2 5,720.3 11,008.8 13,586.6 4,586.7 3,364.3 10,906.8 $14.9 $212.3 $194.5 155.9 637.2 362.0 982.1 388.6 200.0 290.2 $1,809.3 501.4 5,431.8 7,218.8 10,202.9 3,529.6 2,371.4 2,223.4 $2,822.8 Cash and cash equivalents Short-term investments Current assets Total content assets Total assets Current liabilities Long-term debt* Stockholders' equity Cash Flow Data 7,670.0 14,682.0 19,012.7 5,466.3 6,499.4 15,430.8 n.a n.a 52.5 n.a 243.7 57.0 364.7 137.6 (73.3) 226.3 $(22.7) $157.5 (133.2) 13.3 $276.4 (749.4) $(1,474.0) 49.8 1,091.3 $(1,785.9) Net cash (used in) provided by operating activities Net cash provided by (used in) investing activities Net cash provided by (used in) financing activities (179.2) 34.3 48.4 (100.0) 1,640.3 3,077.0 All of Netflix's long-term debt consisted of senior unsecured notes that were issued at various points in time and had various maturity dates and various fixed rates of interest. Sources: Company 10-K Reports for 2003, 2005, 2011, and 2017 Netflix's Performance by Business Segment, 2015-2017 (in millions, except for average monthly revenues per paying member and percentages) EXHIBIT 5 Domestic Streaming Segment 2017 2016 2015 Memberships 43.4 Paid memberships at year-end Trial memberships at year-end 52.8 2.0 54.8 5.5 47.9 Total 49.4 44.7 5.6 Net membership additions 4.7 $ 10.18 $9.21 $8.50 Average monthly revenue per paying membership Revenues Cost of Revenues (Note 1) Marketing costs Contribution profit (Note 2) Contribution margin $6,153.0 3,319.2 $5,077.3 2,855.8 382.8 $1,838.7 $4,180.3 2,487.2 553.3 313.6 $2,280.5 $1,375.5 37% 36% 33% International Streaming Segment Memberships 27.4 2.6 30.0 11.7 Paid memberships at year-end Trial memberships at year-end 57.8 5.0 62.8 18.5 41.2 3.2 44.4 14.3 $7.81 Total Net membership additions Average monthly revenue per paying $8.66 $7.48 membership Revenues Cost of Revenues (Note 1) Marketing costs Contribution profit (Note 2) Contribution margin $5,089.2 4,137.9 724.7 $ 226.6 $3,211.1 2,911.4 608.2 $ (308.5) $1,953.4 1,780.4 506.4 $ (333.6) 4% (1 O)% (1 7)% Domestic DVD Segment Memberships Contribution margin 4% ( 1 O)% (17)% Domestic DVD Segment Memberships 4.0 Paid memberships at year-end Trial memberships at year-end 4.8 .1 4.9 3.3 Total 3.4 Net membership losses 8 $10.17 $ 10.22 $10.30 Average monthly revenue per paying membership Revenues Cost of Revenues (Note 1) Marketing costs Contribution profit (Note 2) Contribution margin $ 450.5 202.5 $ 542.3 262.7 $ 645.7 323.9 $ 248.0 $ 279.5 $ 321.8 55% 52% 50% Global Totals 74.8 Global streaming memberships at year end Global streaming average monthly revenue per paying membership Revenues Operating income Operating margin Net income 93.8 $9.43 $8.61 $8.15 $11,692.7 838.7 $8,830.7 379.8 $6,779.5 305.8 7% 4% 5% $558.9 $ 186.7 $ 122.6 Note 1: Cost of revenues for the domestic and international streaming segments consist mainly of the amortization of streaming content assets, with the remainder relating to the expenses associated with the acquisition, licensing, and production of such content. Cost of revenues in the domestic DVD segment consist primarily of delivery expenses such as packaging and postage costs, content expenses and other expenses associated with the company's DVD processing and customer service centers Note 2: The company defined contribution margin as revenues less cost of revenues and marketing expenses incurred by segment. Source: Company 2017 10-K Report, pp. 19-22 and pp. 59-61 EXHIBIT 7 Netflix's Outstanding Long-Term Debt as of May 2018 Debt Issues Principal Amount at ParIssue Date Maturity DateInterest Due Dates 5.875% Senior Notes 4.875% Senior Notes 3.625% Senior Notes 4.375% Senior Notes 5.50% Senior Notes 5.875% senior Notes 5.750% Senior Notes 5.375% Senior Notes $1.9 billion April 2018 November 2028 April 2028 April 15 and November 15 April 15 and October 15 May 15 and November 15 May 15 and November 15 April 15 and October 15 April 15 and October 15 March 1 and September 1 February 1 and August 1 $1.6 billion 1.561 billion May 2017 October 2017 May 2027 $1.0 billion October 2016 $700 million February 2015 $800 million February 2015 $400 million February 2014 $500 million February 2013 November 2026 February 2022 February 2025 March 2024 February 2021 Sources: Company press release April 23, 2018 and Company 2017 10-K Report, p. 51