

Answered step by step
Verified Expert Solution
Question
1 Approved Answer
What kind of assumptions can you make about the company when you look at their financial statements? What's the cost of capital? How did you
What kind of assumptions can you make about the company when you look at their financial statements? What's the cost of capital? How did you derive your estimate?
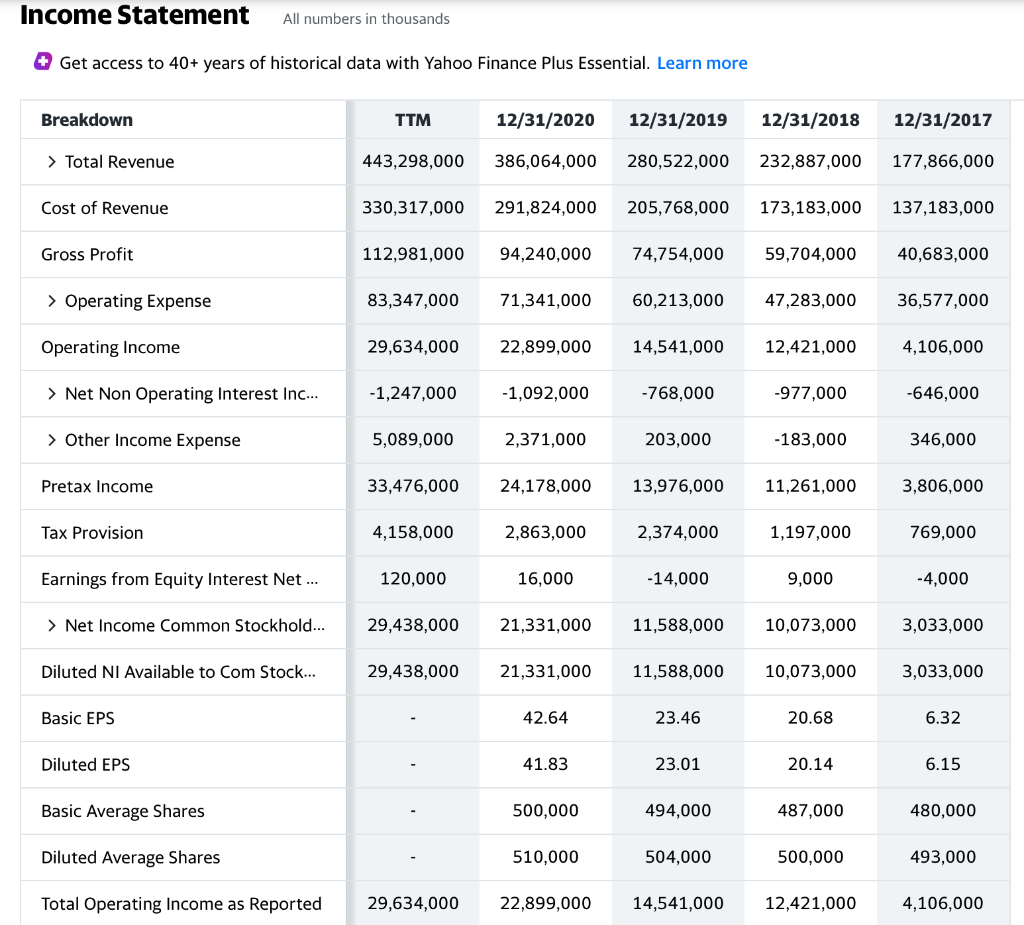
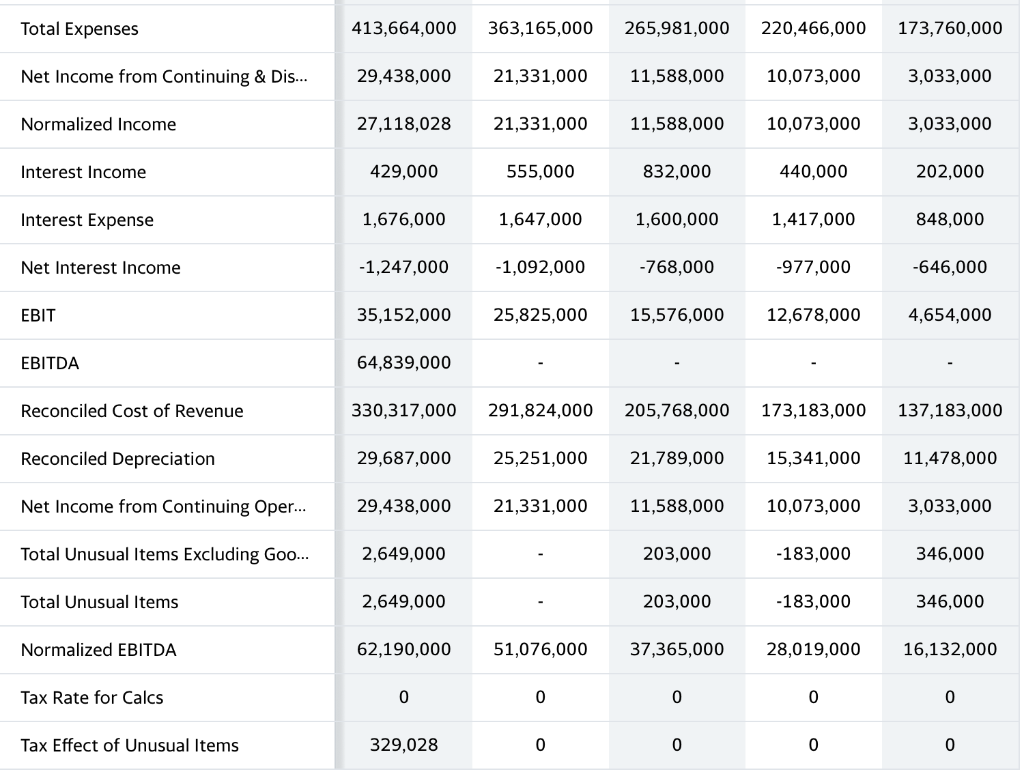
INCOME STATEMENT:
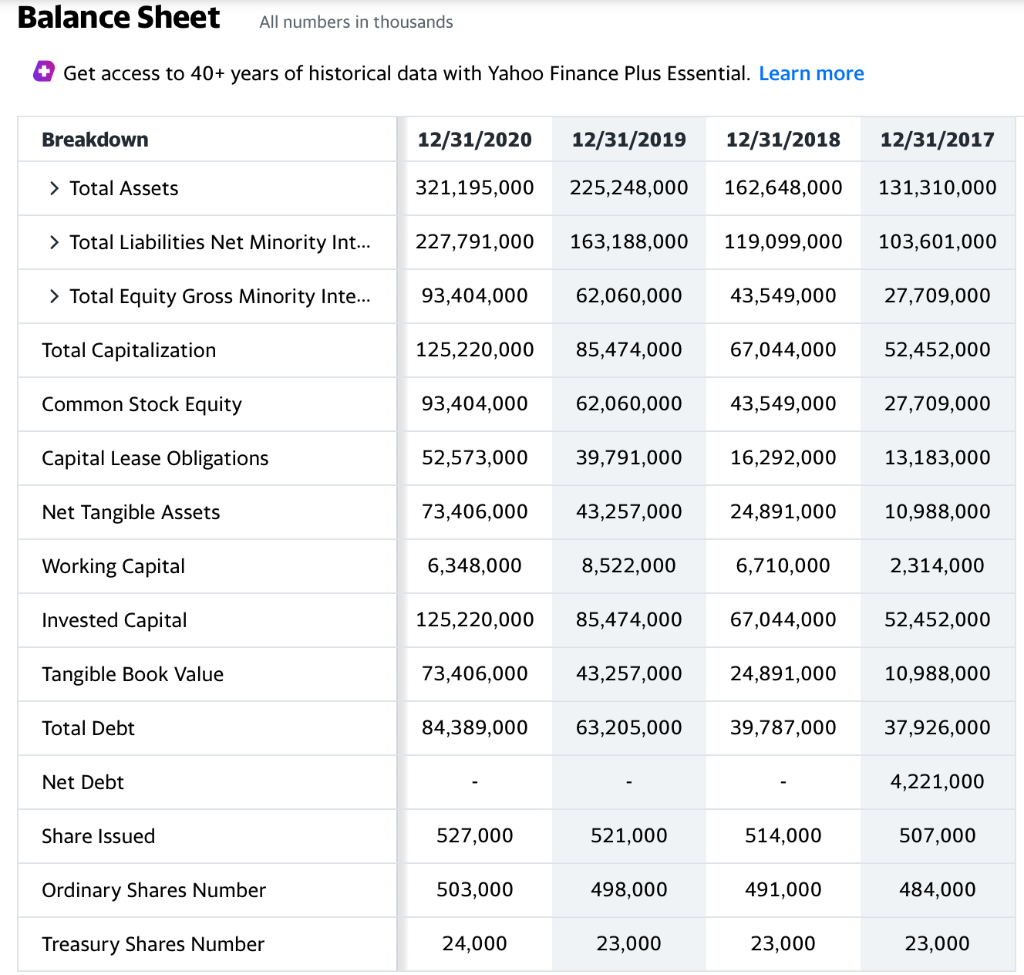
BALANCE SHEET:
CASH FLOW:
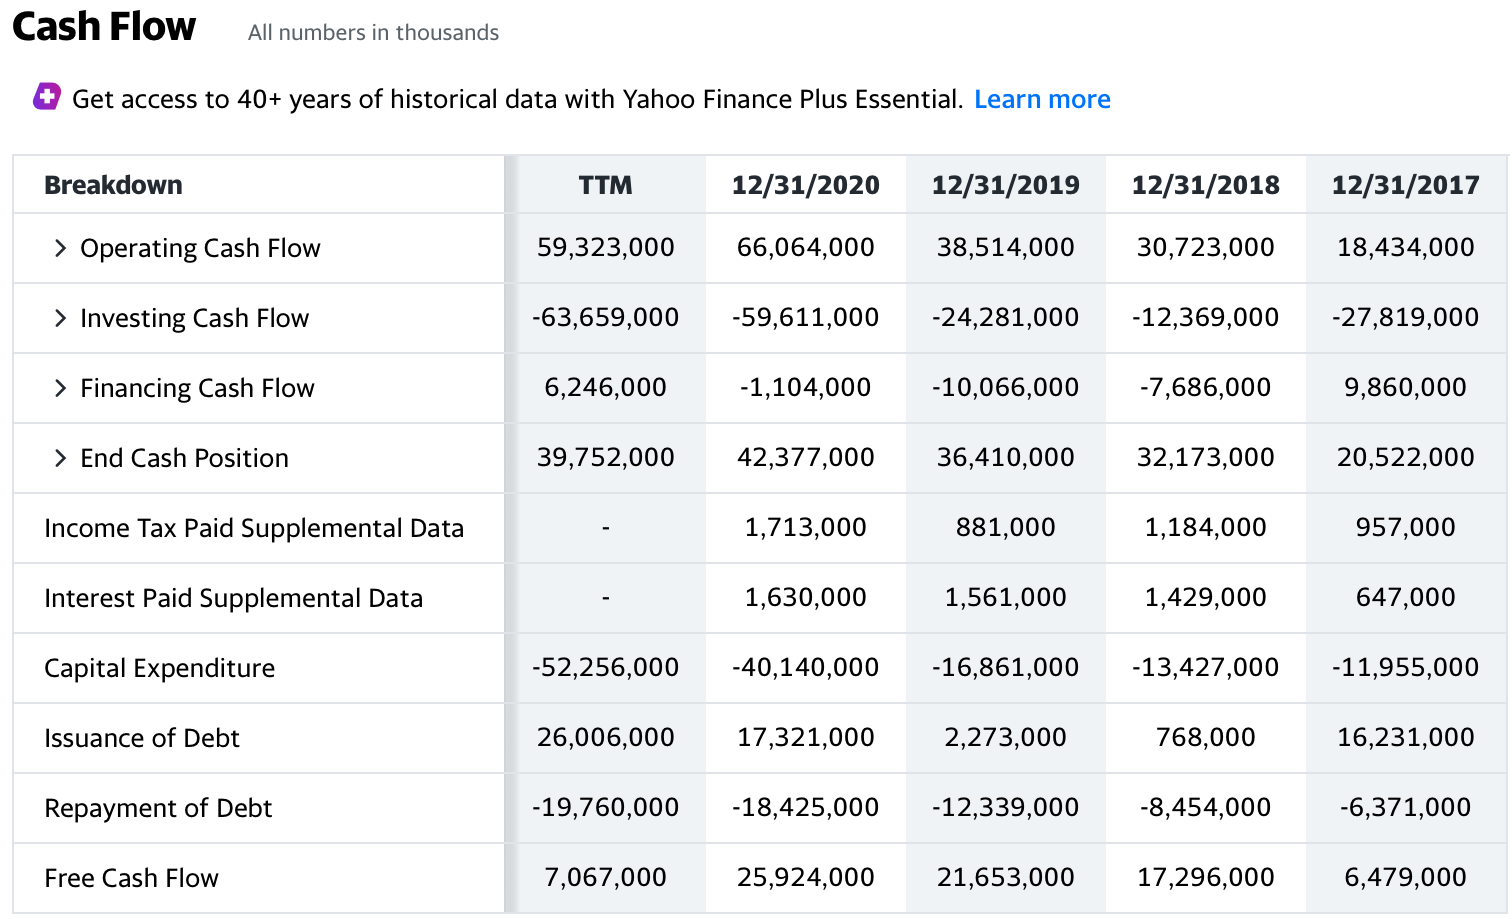
Income Statement All numbers in thousands Get access to 40+ years of historical data with Yahoo Finance Plus Essential. Learn more Breakdown TTM 12/31/2020 12/31/2019 12/31/2018 12/31/2017 > Total Revenue 443,298,000 386,064,000 280,522,000 232,887,000 177,866,000 Cost of Revenue 330,317,000 291,824,000 205,768,000 173,183,000 137,183,000 Gross Profit 112,981,000 94,240,000 74,754,000 59,704,000 40,683,000 > Operating Expense 83,347,000 71,341,000 60,213,000 47,283,000 36,577,000 Operating Income 29,634,000 22,899,000 14,541,000 12,421,000 4,106,000 > Net Non Operating Interest Inc... -1,247,000 -1,092,000 -768,000 -977,000 -646,000 > Other Income Expense 5,089,000 2,371,000 203,000 -183,000 346,000 Pretax Income 33,476,000 24,178,000 13,976,000 11,261,000 3,806,000 Tax Provision 4,158,000 2,863,000 2,374,000 1,197,000 769,000 Earnings from Equity Interest Net ... 120,000 16,000 -14,000 9,000 -4,000 > Net Income Common Stockhold... 29,438,000 21,331,000 11,588,000 10,073,000 3,033,000 Diluted NI Available to Com Stock... 29,438,000 21,331,000 11,588,000 10,073,000 3,033,000 Basic EPS 42.64 23.46 20.68 6.32 Diluted EPS 41.83 23.01 20.14 6.15 Basic Average Shares 500,000 494,000 487,000 480,000 Diluted Average Shares 510,000 504,000 500,000 493,000 Total Operating Income as Reported 29,634,000 22,899,000 14,541,000 12,421,000 4,106,000 Total Expenses 413,664,000 363,165,000 265,981,000 220,466,000 173,760,000 Net Income from Continuing & Dis... 29,438,000 21,331,000 11,588,000 10,073,000 3,033,000 Normalized Income 27,118,028 21,331,000 11,588,000 10,073,000 3,033,000 Interest Income 429,000 555,000 832,000 440,000 202,000 Interest Expense 1,676,000 1,647,000 1,600,000 1,417,000 848,000 Net Interest Income -1,247,000 -1,092,000 -768,000 -977,000 -646,000 EBIT 35,152,000 25,825,000 15,576,000 12,678,000 4,654,000 EBITDA 64,839,000 Reconciled Cost of Revenue 330,317,000 291,824,000 205,768,000 173,183,000 137,183,000 Reconciled Depreciation 29,687,000 25,251,000 21,789,000 15,341,000 11,478,000 Net Income from Continuing Oper... 29,438,000 21,331,000 11,588,000 10,073,000 3,033,000 Total Unusual Items Excluding Goo... 2,649,000 203,000 -183,000 346,000 Total Unusual Items 2,649,000 203,000 -183,000 346,000 Normalized EBITDA 62,190,000 51,076,000 37,365,000 28,019,000 16,132,000 Tax Rate for Calcs 0 0 0 0 0 Tax Effect of Unusual Items 329,028 0 0 0 0 Balance Sheet All numbers in thousands + Get access to 40+ years of historical data with Yahoo Finance Plus Essential. Learn more Breakdown 12/31/2020 12/31/2019 12/31/2018 12/31/2017 > Total Assets 321,195,000 225,248,000 162,648,000 131,310,000 > Total Liabilities Net Minority Int... 227,791,000 163,188,000 119,099,000 103,601,000 > Total Equity Gross Minority Inte... 93,404,000 62,060,000 43,549,000 27,709,000 Total Capitalization 125,220,000 85,474,000 67,044,000 52,452,000 Common Stock Equity 93,404,000 62,060,000 43,549,000 27,709,000 Capital Lease Obligations 52,573,000 39,791,000 16,292,000 13,183,000 Net Tangible Assets 73,406,000 43,257,000 24,891,000 10,988,000 Working Capital 6,348,000 8,522,000 6,710,000 2,314,000 Invested Capital 125,220,000 85,474,000 67,044,000 52,452,000 Tangible Book Value 73,406,000 43,257,000 24,891,000 10,988,000 Total Debt 84,389,000 63,205,000 39,787,000 37,926,000 Net Debt 4,221,000 Share Issued 527,000 521,000 514,000 507,000 Ordinary Shares Number 503,000 498,000 491,000 484,000 Treasury Shares Number 24,000 23,000 23,000 23,000 Cash Flow All numbers in thousands Get access to 40+ years of historical data with Yahoo Finance Plus Essential. Learn more Breakdown TTM 12/31/2020 12/31/2019 12/31/2018 12/31/2017 > Operating Cash Flow 59,323,000 66,064,000 38,514,000 30,723,000 18,434,000 > Investing Cash Flow -63,659,000 -59,611,000 -24,281,000 -12,369,000 -27,819,000 > Financing Cash Flow 6,246,000 -1,104,000 -10,066,000 -7,686,000 9,860,000 > End Cash Position 39,752,000 42,377,000 36,410,000 32,173,000 20,522,000 Income Tax Paid Supplemental Data 1,713,000 881,000 1,184,000 957,000 Interest Paid Supplemental Data 1,630,000 1,561,000 1,429,000 647,000 Capital Expenditure -52,256,000 -40,140,000 -16,861,000 -13,427,000 -11,955,000 Issuance of Debt 26,006,000 17,321,000 2,273,000 768,000 16,231,000 Repayment of Debt -19,760,000 -18,425,000 -12,339,000 -8,454,000 -6,371,000 Free Cash Flow 7,067,000 25,924,000 21,653,000 17,296,000 6,479,000 Income Statement All numbers in thousands Get access to 40+ years of historical data with Yahoo Finance Plus Essential. Learn more Breakdown TTM 12/31/2020 12/31/2019 12/31/2018 12/31/2017 > Total Revenue 443,298,000 386,064,000 280,522,000 232,887,000 177,866,000 Cost of Revenue 330,317,000 291,824,000 205,768,000 173,183,000 137,183,000 Gross Profit 112,981,000 94,240,000 74,754,000 59,704,000 40,683,000 > Operating Expense 83,347,000 71,341,000 60,213,000 47,283,000 36,577,000 Operating Income 29,634,000 22,899,000 14,541,000 12,421,000 4,106,000 > Net Non Operating Interest Inc... -1,247,000 -1,092,000 -768,000 -977,000 -646,000 > Other Income Expense 5,089,000 2,371,000 203,000 -183,000 346,000 Pretax Income 33,476,000 24,178,000 13,976,000 11,261,000 3,806,000 Tax Provision 4,158,000 2,863,000 2,374,000 1,197,000 769,000 Earnings from Equity Interest Net ... 120,000 16,000 -14,000 9,000 -4,000 > Net Income Common Stockhold... 29,438,000 21,331,000 11,588,000 10,073,000 3,033,000 Diluted NI Available to Com Stock... 29,438,000 21,331,000 11,588,000 10,073,000 3,033,000 Basic EPS 42.64 23.46 20.68 6.32 Diluted EPS 41.83 23.01 20.14 6.15 Basic Average Shares 500,000 494,000 487,000 480,000 Diluted Average Shares 510,000 504,000 500,000 493,000 Total Operating Income as Reported 29,634,000 22,899,000 14,541,000 12,421,000 4,106,000 Total Expenses 413,664,000 363,165,000 265,981,000 220,466,000 173,760,000 Net Income from Continuing & Dis... 29,438,000 21,331,000 11,588,000 10,073,000 3,033,000 Normalized Income 27,118,028 21,331,000 11,588,000 10,073,000 3,033,000 Interest Income 429,000 555,000 832,000 440,000 202,000 Interest Expense 1,676,000 1,647,000 1,600,000 1,417,000 848,000 Net Interest Income -1,247,000 -1,092,000 -768,000 -977,000 -646,000 EBIT 35,152,000 25,825,000 15,576,000 12,678,000 4,654,000 EBITDA 64,839,000 Reconciled Cost of Revenue 330,317,000 291,824,000 205,768,000 173,183,000 137,183,000 Reconciled Depreciation 29,687,000 25,251,000 21,789,000 15,341,000 11,478,000 Net Income from Continuing Oper... 29,438,000 21,331,000 11,588,000 10,073,000 3,033,000 Total Unusual Items Excluding Goo... 2,649,000 203,000 -183,000 346,000 Total Unusual Items 2,649,000 203,000 -183,000 346,000 Normalized EBITDA 62,190,000 51,076,000 37,365,000 28,019,000 16,132,000 Tax Rate for Calcs 0 0 0 0 0 Tax Effect of Unusual Items 329,028 0 0 0 0 Balance Sheet All numbers in thousands + Get access to 40+ years of historical data with Yahoo Finance Plus Essential. Learn more Breakdown 12/31/2020 12/31/2019 12/31/2018 12/31/2017 > Total Assets 321,195,000 225,248,000 162,648,000 131,310,000 > Total Liabilities Net Minority Int... 227,791,000 163,188,000 119,099,000 103,601,000 > Total Equity Gross Minority Inte... 93,404,000 62,060,000 43,549,000 27,709,000 Total Capitalization 125,220,000 85,474,000 67,044,000 52,452,000 Common Stock Equity 93,404,000 62,060,000 43,549,000 27,709,000 Capital Lease Obligations 52,573,000 39,791,000 16,292,000 13,183,000 Net Tangible Assets 73,406,000 43,257,000 24,891,000 10,988,000 Working Capital 6,348,000 8,522,000 6,710,000 2,314,000 Invested Capital 125,220,000 85,474,000 67,044,000 52,452,000 Tangible Book Value 73,406,000 43,257,000 24,891,000 10,988,000 Total Debt 84,389,000 63,205,000 39,787,000 37,926,000 Net Debt 4,221,000 Share Issued 527,000 521,000 514,000 507,000 Ordinary Shares Number 503,000 498,000 491,000 484,000 Treasury Shares Number 24,000 23,000 23,000 23,000 Cash Flow All numbers in thousands Get access to 40+ years of historical data with Yahoo Finance Plus Essential. Learn more Breakdown TTM 12/31/2020 12/31/2019 12/31/2018 12/31/2017 > Operating Cash Flow 59,323,000 66,064,000 38,514,000 30,723,000 18,434,000 > Investing Cash Flow -63,659,000 -59,611,000 -24,281,000 -12,369,000 -27,819,000 > Financing Cash Flow 6,246,000 -1,104,000 -10,066,000 -7,686,000 9,860,000 > End Cash Position 39,752,000 42,377,000 36,410,000 32,173,000 20,522,000 Income Tax Paid Supplemental Data 1,713,000 881,000 1,184,000 957,000 Interest Paid Supplemental Data 1,630,000 1,561,000 1,429,000 647,000 Capital Expenditure -52,256,000 -40,140,000 -16,861,000 -13,427,000 -11,955,000 Issuance of Debt 26,006,000 17,321,000 2,273,000 768,000 16,231,000 Repayment of Debt -19,760,000 -18,425,000 -12,339,000 -8,454,000 -6,371,000 Free Cash Flow 7,067,000 25,924,000 21,653,000 17,296,000 6,479,000
Step by Step Solution
There are 3 Steps involved in it
Step: 1

Get Instant Access to Expert-Tailored Solutions
See step-by-step solutions with expert insights and AI powered tools for academic success
Step: 2

Step: 3
Ace Your Homework with AI
Get the answers you need in no time with our AI-driven, step-by-step assistance
Get Started
Forest Resource Economics And Finance
Authors: W. David Klemperer
1st Edition
0974021105, 978-0974021102