What number of diluted weighted-average common shares outstanding was used by P&G in computing earnings per share for 2014, 2013, and 2012? (Round answers to millions upto 1 decimal places, e.g. 125.5.)
| | | (In millions) |
| | | 2014 | | 2013 | | 2012 |
| Weighted-average common shares | | | | | | |
What was P&Gs diluted earnings per share in 2014, 2013, and 2012? (Round answers to 2 decimal places, e.g. 15.25.)
| | 2014 | | 2013 | | 2012 |
| Diluted earnings per share | | $ | | $ | | $ |
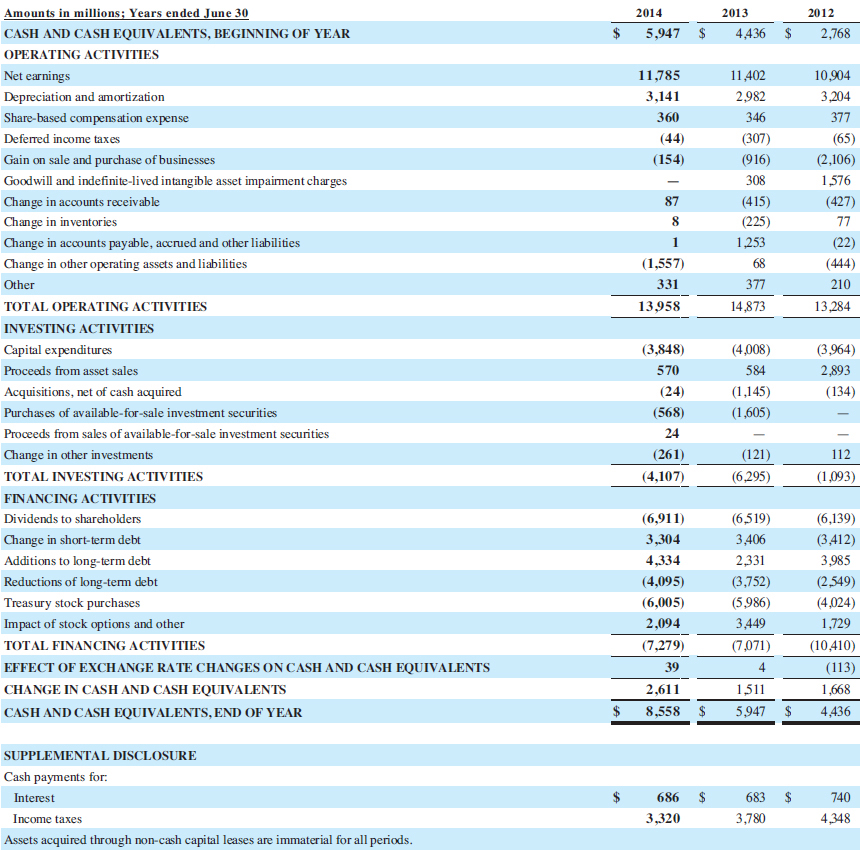
Refer to P&Gs financial statements
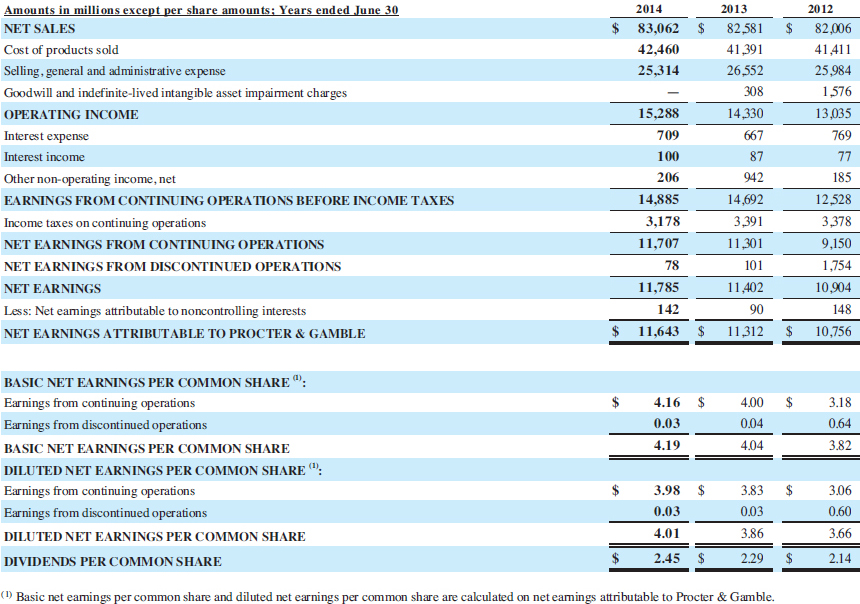
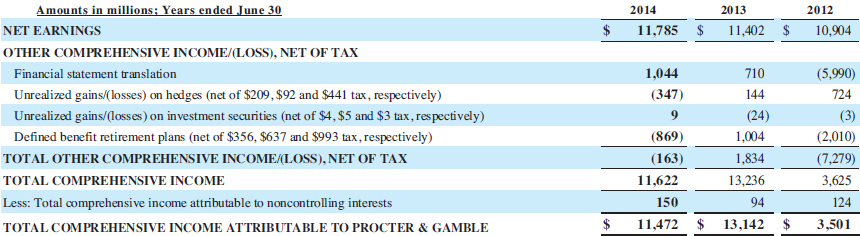
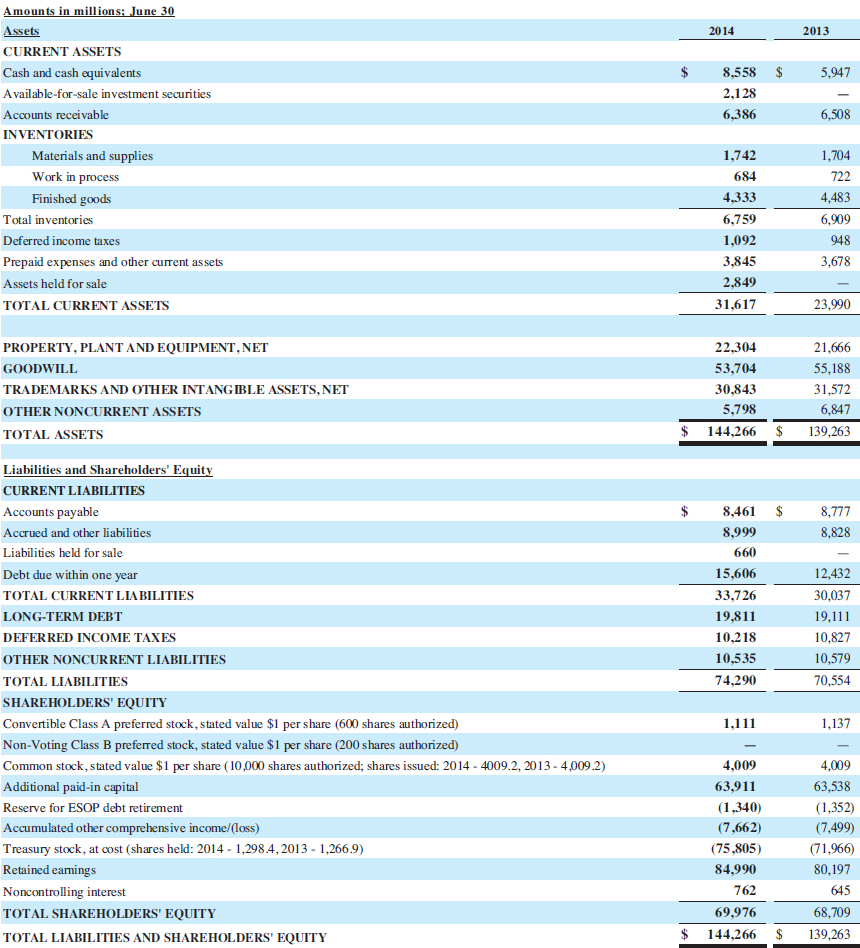
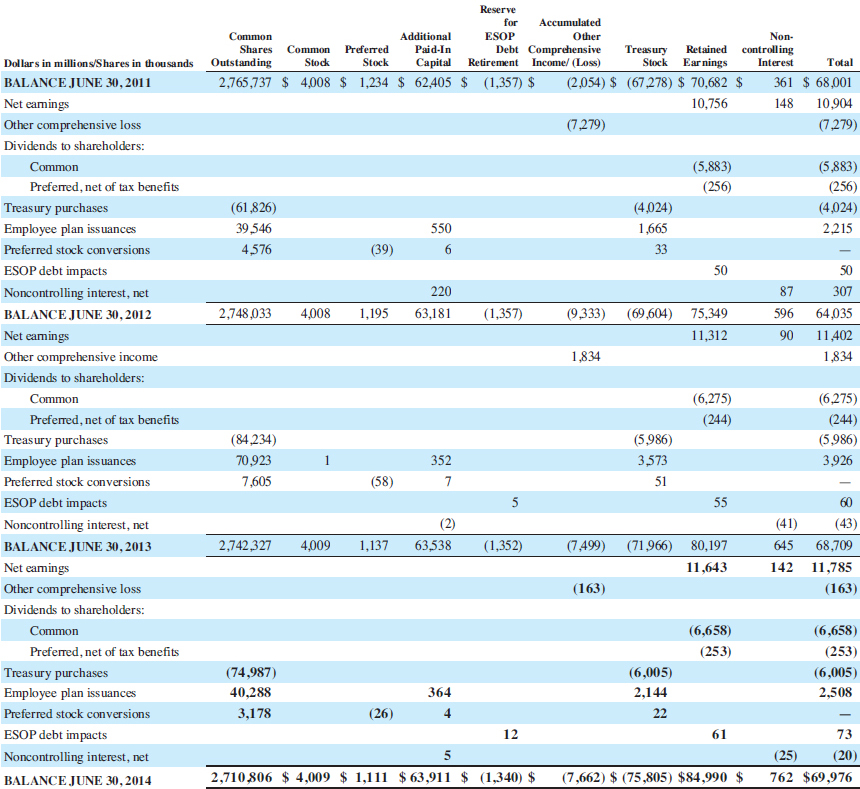
$ $ $ 2014 83,062 42,460 25,314 Amounts in millions except per share amounts: Years ended June 30 NET SALES Cost of products sold Selling, general and administrative expense Goodwill and indefinite-lived intangible asset impairment charges OPERATING INCOME Interest expense Interest income Other non-operating income, net EARNINGS FROM CONTINUING OPERATIONS BEFORE INCOME TAXES Income taxes on continuing operations NET EARNINGS FROM CONTINUING OPERATIONS NET EARNINGS FROM DISCONTINUED OPERATIONS NET EARNINGS Less: Net eamings attributable to noncontrolling interests NET EARNINGS ATTRIBUTABLE TO PROCTER & GAMBLE 2013 82,581 41391 26,552 308 14,330 667 87 942 15,288 709 100 206 14,885 3,178 11,707 2012 82,006 41,411 25,984 1,576 13,035 769 77 185 12,528 3,378 9,150 1,754 10,904 148 10,756 3,391 11,301 101 11,402 90 11,312 11,785 142 11,643 $ $ $ $ $ $ 4.16 0.03 4.19 4.00 0.04 4.04 3.18 0.64 3.82 BASIC NET EARNINGS PER COMMON SHARE": Earnings from continuing operations Earnings from discontinued operations BASIC NET EARNINGS PER COMMON SHARE DILUTED NET EARNINGS PER COMMON SHARE": Earnings from continuing operations Earnings from discontinued operations DILUTED NET EARNINGS PER COMMON SHARE DIVIDENDS PER COMMON SHARE $ $ 3.98 0.03 4.01 2.45 3.83 0.03 3.86 2.29 3.06 0.60 3.66 2.14 $ $ $ (1) Basic net eamings per common share and diluted net earnings per common share are calculated on net eamings attributable to Procter & Gamble. 2014 11,785 2013 11,402 2012 10,904 $ $ $ Amounts in millions; Years ended June 30 NET EARNINGS OTHER COMPREHENSIVE INCOME/(LOSS), NET OF TAX Financial statement translation Unrealized gains/losses) on hedges (net of $209, $92 and $441 tax, respectively) Unrealized gains/(losses) on investment securities (net of $4, $5 and $3 tax, respectively) Defined benefit retirement plans (net of $356, $637 and $993 tax, respectively) TOTAL OTHER COMPREHENSIVE INCOME/LOSS), NET OF TAX TOTAL COMPREHENSIVE INCOME Less: Total comprehensive income attributable to noncontrolling interests TOTAL COMPREHENSIVE INCOME ATTRIBUTABLE TO PROCTER & GAMBLE 1,044 (347) 9 (869) (163) 11,622 150 11,472 710 144 (24) 1,004 1,834 13,236 94 13,142 (5,990) 724 (3) (2,010) (7,279) 3,625 124 3,501 $ $ $ 2014 2013 $ 8,558 $ 5,947 2,128 6,386 6,508 Amounts in millions; June 30 Assets CURRENT ASSETS Cash and cash equivalents Available-for-sale investment securities Accounts receivable INVENTORIES Materials and supplies Work in process Finished goods Total inventories Deferred income taxes Prepaid expenses and other current assets Assets held for sale TOTAL CURRENT ASSETS 1,7421 ,704 684 722 4,333 6,759 1,092 3,845 2,849 31,617 4,483 6,909 948 3,678 23,990 PROPERTY, PLANT AND EQUIPMENT, NET GOODWILL TRADEMARKS AND OTHER INTANGIBLE ASSETS, NET OTHER NONCURRENT ASSETS TOTAL ASSETS 22,304 53,704 30,843 5,798 144,266 21,666 55,188 31,572 6,847 139,263 $ $ $ $ 8,777 8,828 8,461 8.999 660 15,606 33,726 19,811 10,218 10,535 74.290 12,432 30,037 19,111 10,827 10,579 70,554 Liabilities and Shareholders' Equity CURRENT LIABILITIES Accounts payable Accrued and other liabilities Liabilities held for sale Debt due within one year TOTAL CURRENT LIABILITIES LONG-TERM DEBT DEFERRED INCOME TAXES OTHER NONCURRENT LIABILITIES TOTAL LIABILITIES SHAREHOLDERS' EQUITY Convertible Class A preferred stock, stated value $1 per share (600 sha Non-Voting Class B preferred stock, stated value $1 per share (200 shares authorized) Common stock, stated value $1 per share (10,000 shares authorized; shares issued: 2014 - 4009.2, 2013 - 4,009.2) Additional paid-in capital Reserve for ESOP debt retirement Accumulated other comprehensive income/(loss) Treasury stock, at cost (shares held: 2014 - 1,298.4.2013 - 1,266.9) Retained earnings Noncontrolling interest TOTAL SHAREHOLDERS' EQUITY TOTAL LIABILITIES AND SHAREHOLDERS' EQUITY 1,111 1,137 4,009 63,911 (1,340) (7,662) (75,805) 84,990 762 69,976 144,266 4,009 63,538 (1,352) (7,499) (71,966) 80,197 645 68,709 139,263 $ $ Reserve for Accumulated Common Additional ESOP Other Non- Shares Common Preferred Paid-In Debt Comprehensive Treasury Retained controlling Outstanding Stock Stock Capital Retirement Income (Loss) Stock Earnings Interest Total 2,765,737 $ 4,008 $ 1,234 $ 62,405 $ (1,357) $ (2,054) $ (67,278) $ 70,682 $ 361 $ 68,001 10,756 148 10.904 (7,279) (7,279) (5,883) (256) (61,826) 39,546 4,576 550 6 (4,024) 1.665 33 (39) (5,883) (256) (4,024) 2,215 - 50 307 64,035 11,402 1,834 50 220 2,748,033 4,008 1,195 63,181 (1,357) (9,333) (69,604) 75,349 11,312 87 596 90 1,834 Dollars in millions/Shares in thousands BALANCE JUNE 30, 2011 Net eamings Other comprehensive loss Dividends to shareholders: Common Preferred, net of tax benefits Treasury purchases Employee plan issuances Preferred stock conversions ESOP debt impacts Noncontrolling interest, net BALANCE JUNE 30, 2012 Net eamings Other comprehensive income Dividends to shareholders: Common Preferred, net of tax benefits Treasury purchases Employee plan issuances Preferred stock conversions ESOP debt impacts Noncontrolling interest, net BALANCE JUNE 30, 2013 Net eamings Other comprehensive loss Dividends to shareholders: Common Preferred, net of tax benefits Treasury purchases Employee plan issuances Preferred stock conversions ESOP debt impacts Noncontrolling interest, net BALANCE JUNE 30, 2014 (6,275) (244) (6,275) (244) (5,986) 3,926 (84,234) 70,923 7,605 1 352 7 (5.986) 3,573 51 (58) 5 55 2,742,327 4,009 1,137 63,538 (1,352) (7,499) (71.966) 80,197 11,643 (41) 645 142 60 (43) 68,709 11,785 (163) (163) (6,658) (253) (6,658) (253) (6,005) 2,508 (6,005) 2,144 22 (74,987) 40,288 364 3,178 (26) 4 12 5 2,710.806 $ 4,009 $ 1,111 $ 63,911 $ (1,340) $ 61 73 (25) (20) 762 $69,976 (7,662) $ (75,805) $84,990 $ 2014 5,947 2013 4,436 2012 2,768 $ $ $ 11,785 3,141 360 10,904 3,204 (65) (154) 11,402 2.982 346 (307) (916) 308 (415) (225) 1,253 68 377 14,873 87 8 (2,106) 1,576 (427) 77 (22) (444) 210 13,284 1 (1,557) 331 13.958 Amounts in millions; Years ended June 30 CASH AND CASH EQUIVALENTS, BEGINNING OF YEAR OPERATING ACTIVITIES Net earnings Depreciation and amortization Share-based compensation expense Deferred income taxes Gain on sale and purchase of businesses Goodwill and indefinite-lived intangible asset impairment charges Change in accounts receivable Change in inventories Change in accounts payable, accrued and other liabilities Change in other operating assets and liabilities Other TOTAL OPERATING ACTIVITIES INVESTING ACTIVITIES Capital expenditures Proceeds from asset sales Acquisitions, net of cash acquired Purchases of available-for-sale investment securities Proceeds from sales of available-for-sale investment securities Change in other investments TOTAL INVESTING ACTIVITIES FINANCING ACTIVITIES Dividends to shareholders Change in short-term debt Additions to long-term debt Reductions of long-term debt Treasury stock purchases Impact of stock options and other TOTAL FINANCING ACTIVITIES EFFECT OF EXCHANGE RATE CHANGES ON CASH AND CASH EQUIVALENTS CHANGE IN CASH AND CASH EQUIVALENTS CASH AND CASH EQUIVALENTS, END OF YEAR (3,848) 570 (24) (568) (4,008) 584 (1,145) (1.605) (3,964) 2,893 (134) - - 112 (1,093) 24 (261) (4,107) (121) (6,295) (6,911) 3,304 4,334 (4,095) (6,005) 2,094 (7,279) (6,519) (6,139) 3,406 (3,412) 2,331 3,985 (3,752) (2,549) (5.986) (4,024) 3,449 1,729 (7,071) (10,410) (113) 15111 ,668 5,947 $ 4,436 2,611 8,558 $ $ SUPPLEMENTAL DISCLOSURE Cash payments for: Interest Income taxes Assets acquired through non-cash capital leases are immaterial for all periods. $ $ $ 686 3,320 683 3,780 740 4.348