

Question: What should Larson recommend? You can use numbers from the case Exhibits 26.1-8 and the analysis above to justify your argument. EXHIBIT 26.11 Consolidated Income
What should Larson recommend? You can use numbers from the case Exhibits 26.1-8 and the analysis above to justify your argument.
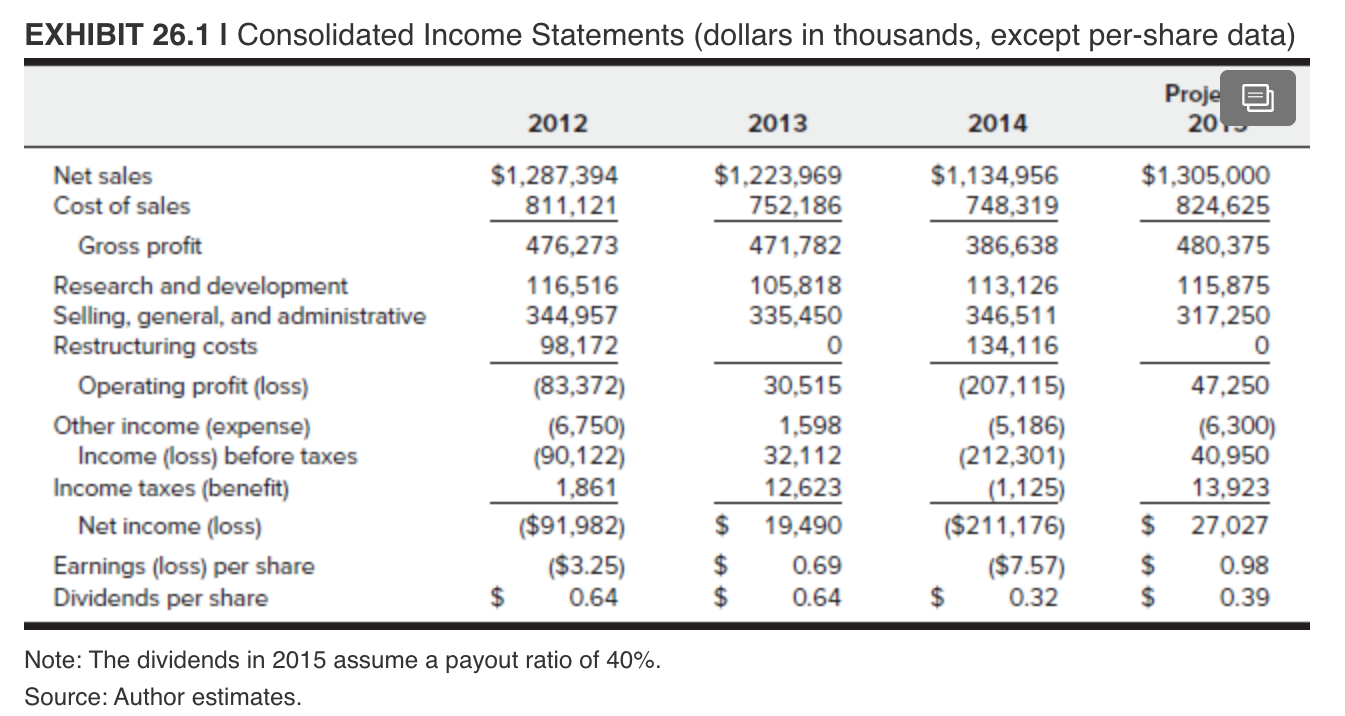
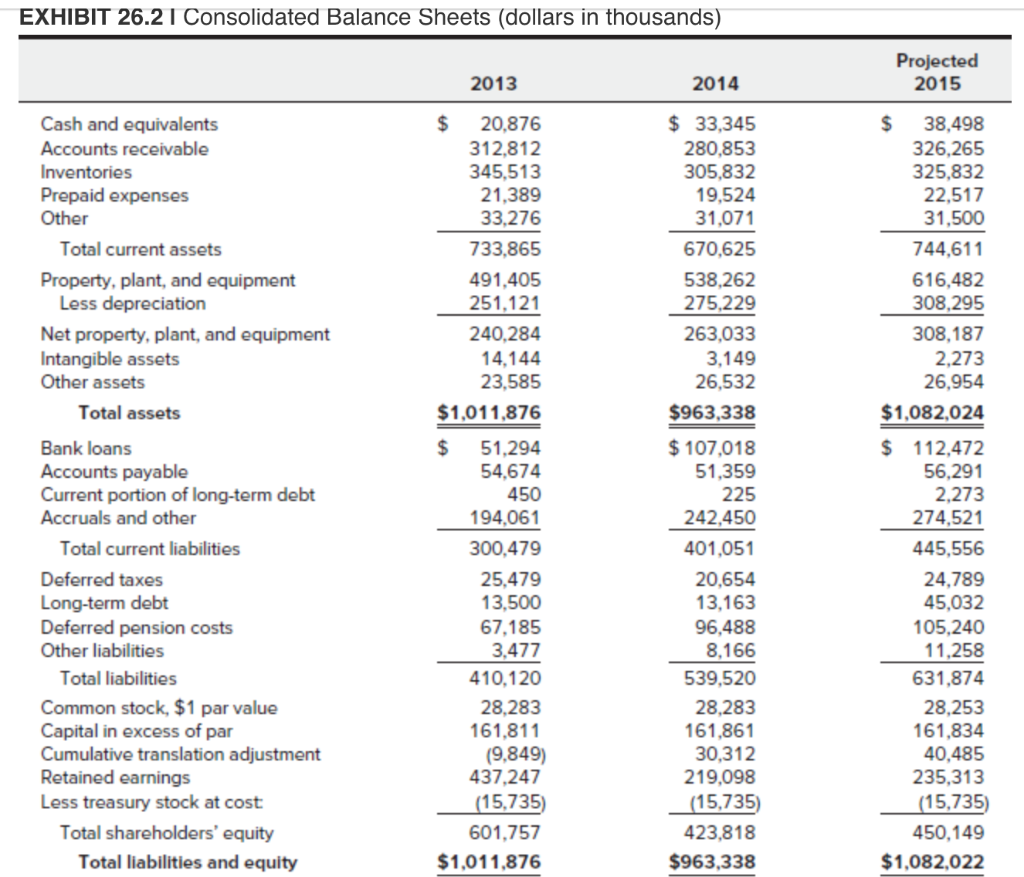
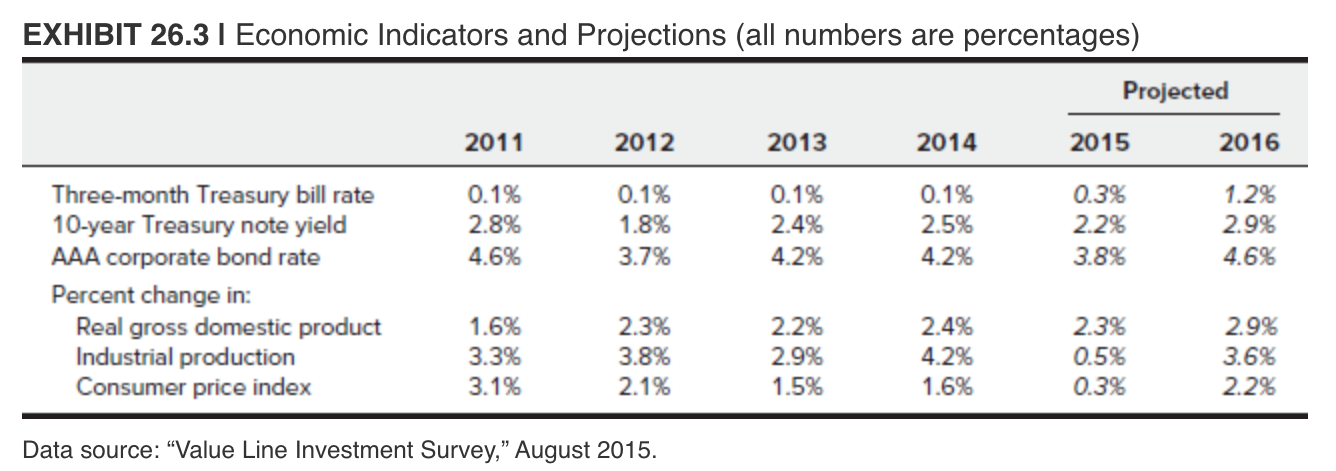
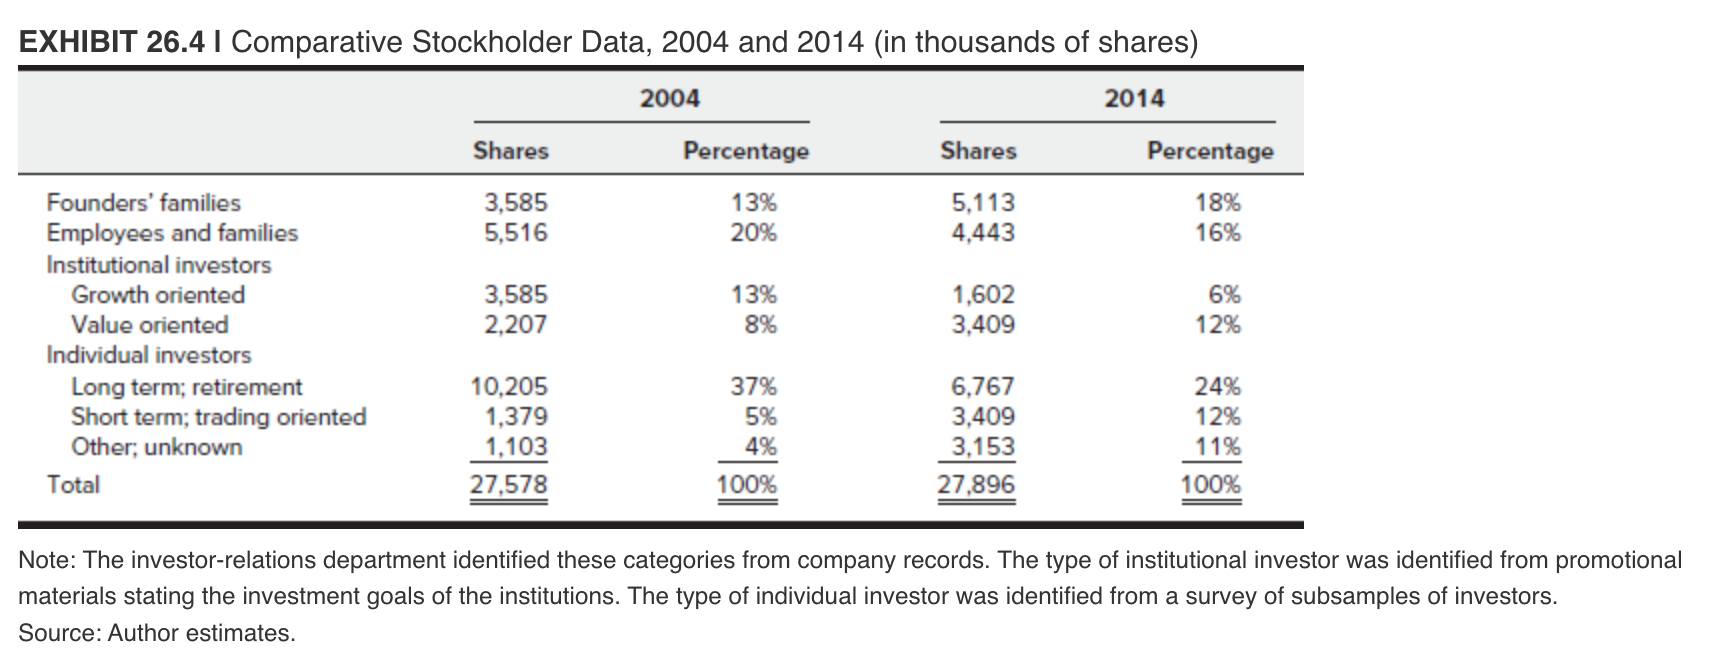
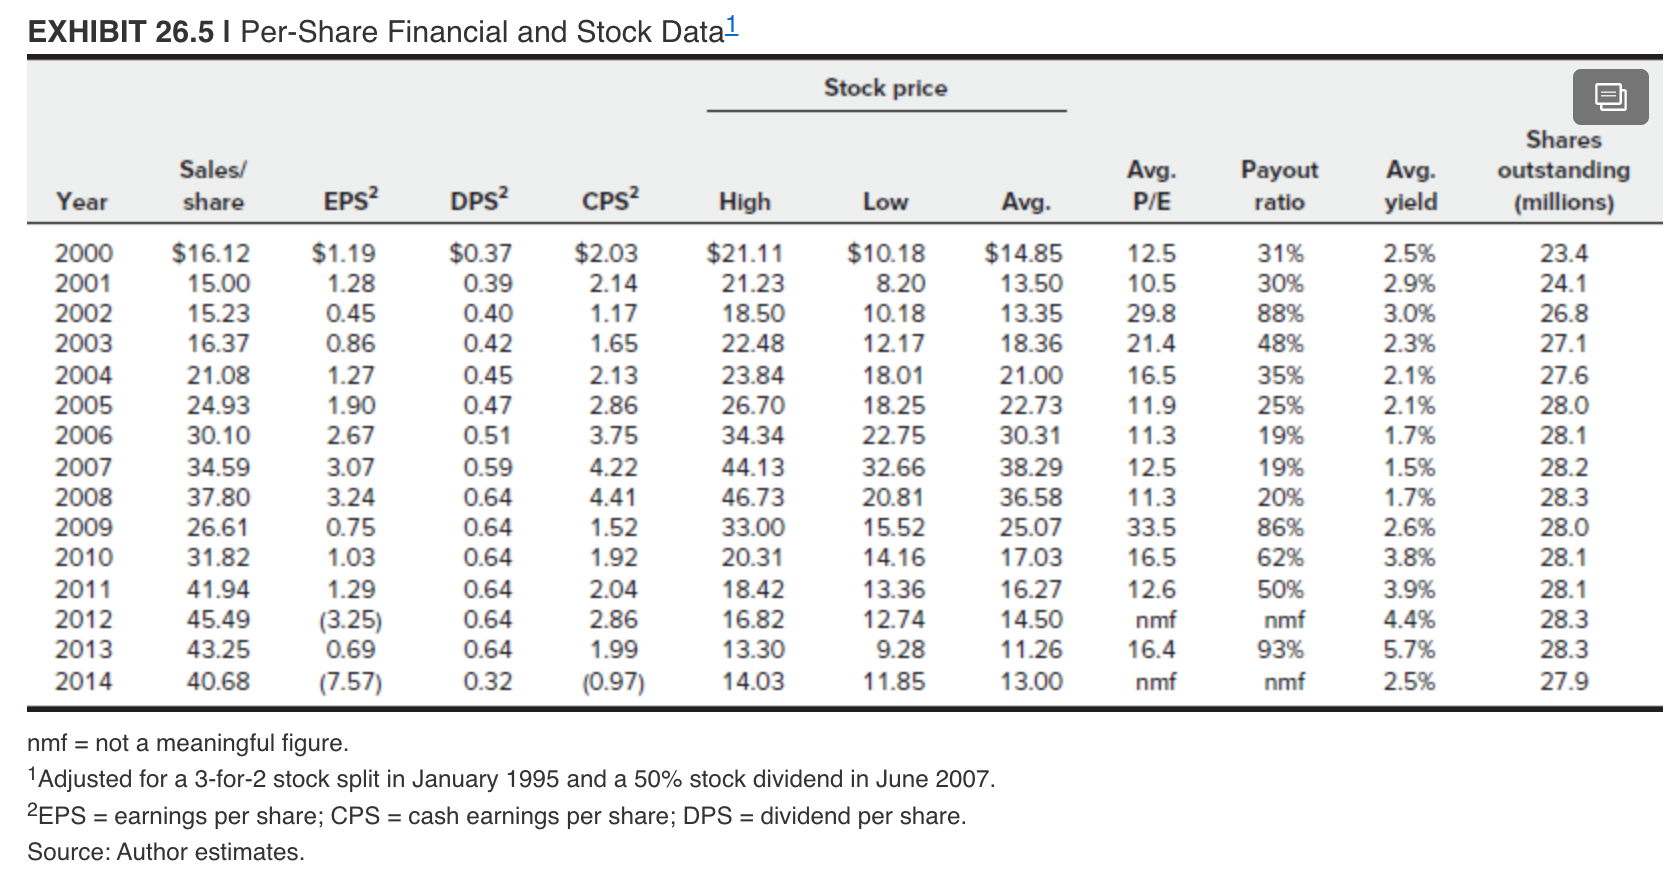
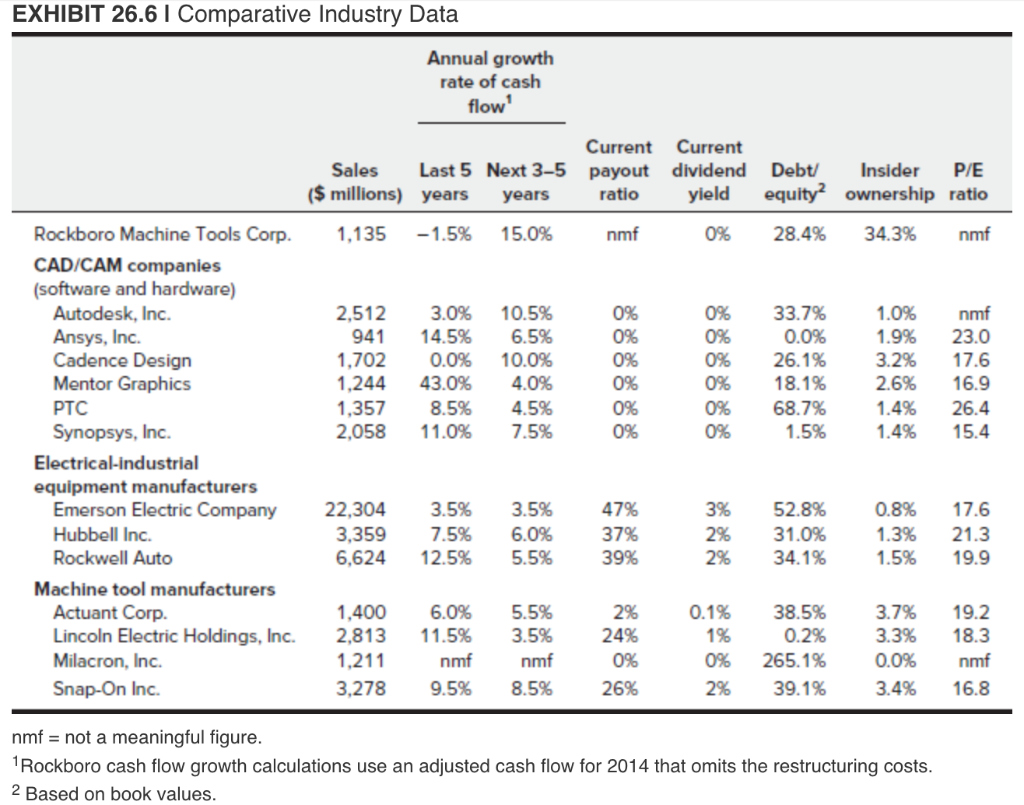
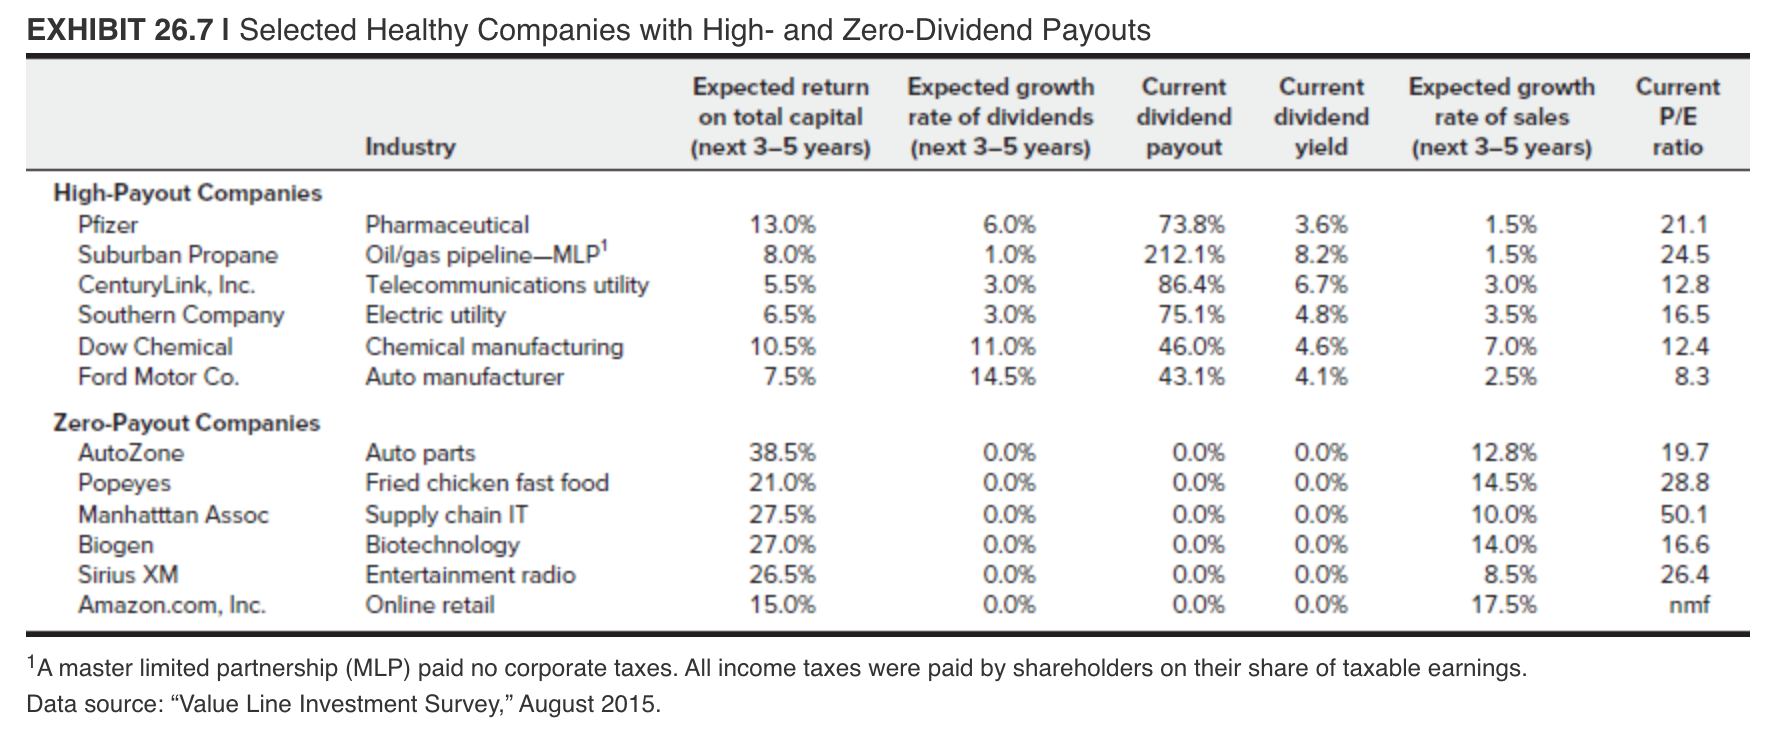
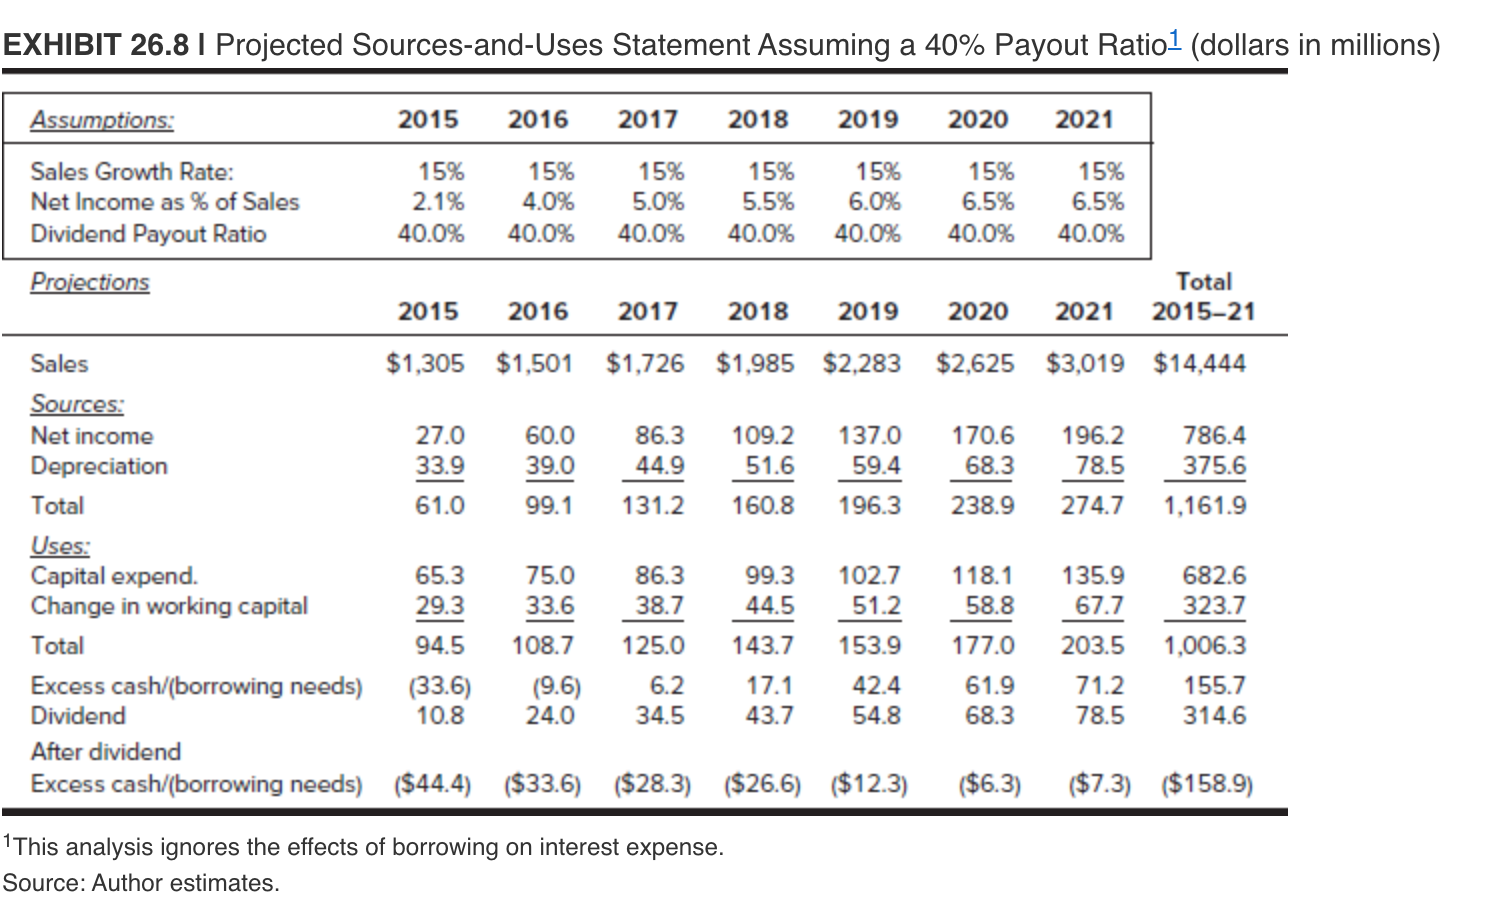
EXHIBIT 26.11 Consolidated Income Statements (dollars in thousands, except per-share data) Proje 20 2012 2013 2014 Net sales Cost of sales Gross profit Research and development Selling, general, and administrative Restructuring costs Operating profit (loss) Other income (expense) Income (loss) before taxes Income taxes (benefit) Net income (loss) Earnings (loss) per share Dividends per share $1,287,394 811,121 476,273 116,516 344,957 98,172 (83,372) (6,750) (90,122) 1.861 ($91,982) ($3.25) $ 0.64 $1,223,969 752,186 471,782 105,818 335,450 0 30,515 1,598 32,112 12.623 $ 19,490 $ 0.69 $ 0.64 $1,134,956 748,319 386,638 113,126 346,511 134,116 (207,115) (5,186) (212,301) (1,125) ($211,176) ($7.57) $ 0.32 $1,305,000 824,625 480,375 115,875 317,250 0 47,250 (6,300) 40,950 13,923 $ 27,027 $ 0.98 $ 0.39 Note: The dividends in 2015 assume a payout ratio of 40%. Source: Author estimates. EXHIBIT 26.21 Consolidated Balance Sheets (dollars in thousands) Projected 2015 2013 2014 $ 20.876 312,812 345,513 21.389 33.276 733.865 491,405 251,121 240.284 14,144 23,585 $1,011,876 $ 38,498 326,265 325,832 22,517 31,500 744.611 616,482 308,295 308,187 2,273 26,954 $1,082,024 Cash and equivalents Accounts receivable Inventories Prepaid expenses Other Total current assets Property, plant, and equipment Less depreciation Net property, plant, and equipment Intangible assets Other assets Total assets Bank loans Accounts payable Current portion of long-term debt Accruals and other Total current liabilities Deferred taxes Long-term debt Deferred pension costs Other liabilities Total liabilities Common stock, $1 par value Capital in excess of par Cumulative translation adjustment Retained earnings Less treasury stock at cost Total shareholders' equity Total liabilities and equity $ 51,294 54,674 450 194,061 300,479 25,479 13.500 67,185 3,477 410,120 28.283 161.811 (9,849) 437,247 (15,735) 601,757 $1,011,876 $ 33,345 280,853 305,832 19,524 31,071 670,625 538,262 275,229 263,033 3,149 26,532 $963,338 $ 107,018 51,359 225 242,450 401,051 20,654 13,163 96,488 8,166 539,520 28,283 161,861 30,312 219,098 (15,735) 423,818 $963,338 $ 112,472 56,291 2,273 274,521 445,556 24,789 45,032 105.240 11.258 631.874 28.253 161.834 40,485 235,313 (15,735) 450,149 $1,082,022 EXHIBIT 26.31 Economic Indicators and Projections (all numbers are percentages) Projected 2011 2012 2013 2014 2015 2016 0.1% 2.8% 4.6% 0.1% 1.8% 3.7% 0.1% 2.4% 4.2% 0.1% 2.5% 4.2% 0.3% 2.2% 3.8% 1.2% 2.9% 4.6% Three-month Treasury bill rate 10-year Treasury note yield AAA corporate bond rate Percent change in: Real gross domestic product Industrial production Consumer price index 2.3% 1.6% 3.3% 3.1% 2.3% 3.8% 2.1% 2.2% 2.9% 1.5% 2.4% 4.2% 1.6% 0.5% 0.3% 2.9% 3.6% 2.2% Data source: Value Line Investment Survey, August 2015. EXHIBIT 26.4 I Comparative Stockholder Data, 2004 and 2014 (in thousands of shares) 2004 2014 Shares Shares 3,585 Percentage 13% 20% 5,113 Percentage 18% 16% 5,516 4,443 3,585 2,207 13% 8% Founders' families Employees and families Institutional investors Growth oriented Value oriented Individual investors Long term; retirement Short term; trading oriented Other, unknown Total 1,602 3,409 6% 12% 37% 5% 10,205 1,379 1,103 27,578 6,767 3,409 3,153 27,896 24% 12% 11% 100% 4% 100% Note: The investor-relations department identified these categories from company records. The type of institutional investor was identified from promotional materials stating the investment goals of the institutions. The type of individual investor was identified from a survey of subsamples of investors. Source: Author estimates. EXHIBIT 26.5 | Per-Share Financial and Stock Data1 Stock price Shares outstanding (millions) DPS? CPS Avg. yield Low Avg. Payout ratio 31% 30% 88% 48% 35% Year 2000 2001 2002 2003 2004 2005 2006 2007 2008 2009 2010 2011 2012 2013 2014 Sales/ share $16.12 15.00 15.23 16.37 21.08 24.93 30.10 34.59 37.80 26.61 31.82 41.94 45.49 43.25 40.68 EPS? $1.19 1.28 0.45 0.86 1.27 1.90 2.67 3.07 3.24 0.75 1.03 1.29 (3.25) 0.69 (7.57) $0.37 0.39 0.40 0.42 0.45 0.47 0.51 0.59 0.64 0.64 0.64 0.64 0.64 0.64 0.32 High $21.11 21.23 18.50 22.48 23.84 26.70 34.34 44.13 46.73 33.00 20.31 18.42 16.82 13.30 14.03 $2.03 2.14 1.17 1.65 2.13 2.86 3.75 4.22 4.41 1.52 1.92 2.04 2.86 1.99 (0.97) 25% 19% $10.18 8.20 10.18 12.17 18.01 18.25 22.75 32.66 20.81 15.52 14.16 13.36 12.74 9.28 11.85 Avg. P/E 12.5 10.5 29.8 21.4 16.5 11.9 11.3 12.5 11.3 33.5 16.5 12.6 nmf 16.4 nmf $14.85 13.50 13.35 18.36 21.00 22.73 30.31 38.29 36.58 25.07 17.03 16.27 14.50 11.26 13.00 19% 2.5% 2.9% 3.0% 2.3% 2.1% 2.1% 1.7% 1.5% 1.7% 2.6% 3.8% 3.9% 4.4% 5.7% 2.5% 23.4 24.1 26.8 27.1 27.6 28.0 28.1 28.2 28.3 28.0 28.1 28.1 28.3 28.3 27.9 20% 86% 62% 50% nmf 93% nmf nmf = not a meaningful figure. 1Adjusted for a 3-for-2 stock split in January 1995 and a 50% stock dividend in June 2007. 2EPS = earnings per share; CPS = cash earnings per share; DPS = dividend per share. Source: Author estimates. = EXHIBIT 26.6 I Comparative Industry Data Annual growth rate of cash flow' Current Current Sales Last 5 Next 3-5 payout dividend ($ millions) years years ratio yield Debt Insider P/E equity? ownership ratio 28.4% 34.3% nmf 1,135 -1.5% 15.0% nmf 0% 2,512 941 1,702 1,244 1,357 2,058 3.0% 14.5% 0.0% 43.0% 8.5% 11.0% 10.5% 6.5% 10.0% 4.0% 4.5% 7.5% 0% 0% 0% 0% 0% 0% 0% 0% 0% 0% 0% 0% 33.7% 0.0% 26.1% 18.1% 68.7% 1.5% 1.0% 1.9% 3.2% 2.6% 1.4% 1.4% nmf 23.0 17.6 16.9 26.4 15.4 Rockboro Machine Tools Corp. CAD/CAM companies (software and hardware) Autodesk, Inc. Ansys, Inc. Cadence Design Mentor Graphics PTC Synopsys, Inc. Elect ndustr equipment manufacturers Emerson Electric Company Hubbell Inc. Rockwell Auto Machine tool manufacturers Actuant Corp. Lincoln Electric Holdings, Inc. Milacron, Inc. Snap-On Inc. 22,304 3,359 6,624 3.5% 7.5% 12.5% 3.5% 6.0% 5.5% 47% 37% 39% 3% 2% 2% 52.8% 31.0% 34.1% 0.8% 1.3% 1.5% 17.6 21.3 19.9 1,400 2.813 1,211 3,278 6.0% 11.5% nmf 9.5% 5.5% 3.5% nmf 8.5% 2% 24% 0% 26% 0.1% 1% 0% 2% 38.5% 0.2% 265.1% 39.1% 3.7% 3.3% 0.0% 3.4% 19.2 18.3 nmf 16.8 nmf = not a meaningful figure. Rockboro cash flow growth calculations use an adjusted cash flow for 2014 that omits the restructuring costs. 2 Based on book values. Current dividend yield Expected growth rate of sales (next 3-5 years) Current P/E ratio EXHIBIT 26.7 | Selected Healthy Companies with High- and Zero-Dividend Payouts Expected return Expected growth Current on total capital rate of dividends dividend Industry (next 3-5 years) (next 3-5 years) payout High-Payout Companies Pfizer Pharmaceutical 13.0% 6.0% 73.8% Suburban Propane Oil/gas pipeline_MLP? 8.0% 1.0% 212.1% CenturyLink, Inc. Telecommunications utility 5.5% 3.0% 86.4% Southern Company Electric utility 6.5% 3.0% 75.1% Dow Chemical Chemical manufacturing 10.5% 11.0% 46.0% Ford Motor Co. Auto manufacturer 7.5% 14.5% 43.1% Zero-Payout Companies AutoZone Auto parts 38.5% 0.0% 0.0% Popeyes Fried chicken fast food 21.0% 0.0% 0.0% Manhatttan Assoc Supply chain IT 27.5% 0.0% 0.0% Biogen Biotechnology 27.0% 0.0% 0.0% Sirius XM Entertainment radio 26.5% 0.0% 0.0% Amazon.com, Inc. Online retail 15.0% 0.0% 0.0% 3.6% 8.2% 6.7% 4.8% 4.6% 4.1% 1.5% 1.5% 3.0% 3.5% 7.0% 2.5% 21.1 24.5 12.8 16.5 12.4 8.3 0.0% 0.0% 0.0% 0.0% 0.0% 0.0% 12.8% 14.5% 10.0% 14.0% 8.5% 17.5% 19.7 28.8 50.1 16.6 26.4 nmf 1A master limited partnership (MLP) paid no corporate taxes. All income taxes were paid by shareholders on their share of taxable earnings. Data source: Value Line Investment Survey, August 2015. EXHIBIT 26.8 I Projected Sources-and-Uses Statement Assuming a 40% Payout Ratio 1 (dollars in millions) Assumptions: 2015 2016 2017 2018 2019 2020 2021 Sales Growth Rate: 15% 15% 15% 15% 15% 15% 15% Net Income as % of Sales 2.1% 4.0% 5.0% 5.5% 6.0% 6.5% 6.5% Dividend Payout Ratio 40.0% 40.0% 40.0% 40.0% 40.0% 40.0% 40.0% Projections Total 2015 2016 2017 2018 2019 2020 2021 2015-21 Sales $1,305 $1,501 $1,726 $1,985 $2,283 $2,625 $3,019 $14,444 Sources: Net income 27.0 60.0 86.3 109.2 137.0 170.6 196.2 786.4 Depreciation 33.9 39.0 44.9 51.6 59.4 68.3 78.5 375.6 Total 61.0 99.1 131.2 160.8 196.3 238.9 274.7 1,161.9 Uses: Capital expend. 65.3 75.0 86.3 99.3 102.7 118.1 135.9 682.6 Change in working capital 29.3 33.6 38.7 44.5 58.8 67.7 323.7 Total 94.5 108.7 125.0 143.7 153.9 177.0 203.5 1,006.3 Excess cash/(borrowing needs) (33.6) (9.6) 6.2 17.1 42.4 61.9 71.2 155.7 Dividend 10.8 24.0 34.5 43.7 54.8 68.3 78.5 314.6 After dividend Excess cash/(borrowing needs) ($44.4) ($33.6) ($28.3) ($26.6) ($12.3) ($6.3) ($7.3) ($158.9) 51.2 1This analysis ignores the effects of borrowing on interest expense. Source: Author estimates. EXHIBIT 26.11 Consolidated Income Statements (dollars in thousands, except per-share data) Proje 20 2012 2013 2014 Net sales Cost of sales Gross profit Research and development Selling, general, and administrative Restructuring costs Operating profit (loss) Other income (expense) Income (loss) before taxes Income taxes (benefit) Net income (loss) Earnings (loss) per share Dividends per share $1,287,394 811,121 476,273 116,516 344,957 98,172 (83,372) (6,750) (90,122) 1.861 ($91,982) ($3.25) $ 0.64 $1,223,969 752,186 471,782 105,818 335,450 0 30,515 1,598 32,112 12.623 $ 19,490 $ 0.69 $ 0.64 $1,134,956 748,319 386,638 113,126 346,511 134,116 (207,115) (5,186) (212,301) (1,125) ($211,176) ($7.57) $ 0.32 $1,305,000 824,625 480,375 115,875 317,250 0 47,250 (6,300) 40,950 13,923 $ 27,027 $ 0.98 $ 0.39 Note: The dividends in 2015 assume a payout ratio of 40%. Source: Author estimates. EXHIBIT 26.21 Consolidated Balance Sheets (dollars in thousands) Projected 2015 2013 2014 $ 20.876 312,812 345,513 21.389 33.276 733.865 491,405 251,121 240.284 14,144 23,585 $1,011,876 $ 38,498 326,265 325,832 22,517 31,500 744.611 616,482 308,295 308,187 2,273 26,954 $1,082,024 Cash and equivalents Accounts receivable Inventories Prepaid expenses Other Total current assets Property, plant, and equipment Less depreciation Net property, plant, and equipment Intangible assets Other assets Total assets Bank loans Accounts payable Current portion of long-term debt Accruals and other Total current liabilities Deferred taxes Long-term debt Deferred pension costs Other liabilities Total liabilities Common stock, $1 par value Capital in excess of par Cumulative translation adjustment Retained earnings Less treasury stock at cost Total shareholders' equity Total liabilities and equity $ 51,294 54,674 450 194,061 300,479 25,479 13.500 67,185 3,477 410,120 28.283 161.811 (9,849) 437,247 (15,735) 601,757 $1,011,876 $ 33,345 280,853 305,832 19,524 31,071 670,625 538,262 275,229 263,033 3,149 26,532 $963,338 $ 107,018 51,359 225 242,450 401,051 20,654 13,163 96,488 8,166 539,520 28,283 161,861 30,312 219,098 (15,735) 423,818 $963,338 $ 112,472 56,291 2,273 274,521 445,556 24,789 45,032 105.240 11.258 631.874 28.253 161.834 40,485 235,313 (15,735) 450,149 $1,082,022 EXHIBIT 26.31 Economic Indicators and Projections (all numbers are percentages) Projected 2011 2012 2013 2014 2015 2016 0.1% 2.8% 4.6% 0.1% 1.8% 3.7% 0.1% 2.4% 4.2% 0.1% 2.5% 4.2% 0.3% 2.2% 3.8% 1.2% 2.9% 4.6% Three-month Treasury bill rate 10-year Treasury note yield AAA corporate bond rate Percent change in: Real gross domestic product Industrial production Consumer price index 2.3% 1.6% 3.3% 3.1% 2.3% 3.8% 2.1% 2.2% 2.9% 1.5% 2.4% 4.2% 1.6% 0.5% 0.3% 2.9% 3.6% 2.2% Data source: Value Line Investment Survey, August 2015. EXHIBIT 26.4 I Comparative Stockholder Data, 2004 and 2014 (in thousands of shares) 2004 2014 Shares Shares 3,585 Percentage 13% 20% 5,113 Percentage 18% 16% 5,516 4,443 3,585 2,207 13% 8% Founders' families Employees and families Institutional investors Growth oriented Value oriented Individual investors Long term; retirement Short term; trading oriented Other, unknown Total 1,602 3,409 6% 12% 37% 5% 10,205 1,379 1,103 27,578 6,767 3,409 3,153 27,896 24% 12% 11% 100% 4% 100% Note: The investor-relations department identified these categories from company records. The type of institutional investor was identified from promotional materials stating the investment goals of the institutions. The type of individual investor was identified from a survey of subsamples of investors. Source: Author estimates. EXHIBIT 26.5 | Per-Share Financial and Stock Data1 Stock price Shares outstanding (millions) DPS? CPS Avg. yield Low Avg. Payout ratio 31% 30% 88% 48% 35% Year 2000 2001 2002 2003 2004 2005 2006 2007 2008 2009 2010 2011 2012 2013 2014 Sales/ share $16.12 15.00 15.23 16.37 21.08 24.93 30.10 34.59 37.80 26.61 31.82 41.94 45.49 43.25 40.68 EPS? $1.19 1.28 0.45 0.86 1.27 1.90 2.67 3.07 3.24 0.75 1.03 1.29 (3.25) 0.69 (7.57) $0.37 0.39 0.40 0.42 0.45 0.47 0.51 0.59 0.64 0.64 0.64 0.64 0.64 0.64 0.32 High $21.11 21.23 18.50 22.48 23.84 26.70 34.34 44.13 46.73 33.00 20.31 18.42 16.82 13.30 14.03 $2.03 2.14 1.17 1.65 2.13 2.86 3.75 4.22 4.41 1.52 1.92 2.04 2.86 1.99 (0.97) 25% 19% $10.18 8.20 10.18 12.17 18.01 18.25 22.75 32.66 20.81 15.52 14.16 13.36 12.74 9.28 11.85 Avg. P/E 12.5 10.5 29.8 21.4 16.5 11.9 11.3 12.5 11.3 33.5 16.5 12.6 nmf 16.4 nmf $14.85 13.50 13.35 18.36 21.00 22.73 30.31 38.29 36.58 25.07 17.03 16.27 14.50 11.26 13.00 19% 2.5% 2.9% 3.0% 2.3% 2.1% 2.1% 1.7% 1.5% 1.7% 2.6% 3.8% 3.9% 4.4% 5.7% 2.5% 23.4 24.1 26.8 27.1 27.6 28.0 28.1 28.2 28.3 28.0 28.1 28.1 28.3 28.3 27.9 20% 86% 62% 50% nmf 93% nmf nmf = not a meaningful figure. 1Adjusted for a 3-for-2 stock split in January 1995 and a 50% stock dividend in June 2007. 2EPS = earnings per share; CPS = cash earnings per share; DPS = dividend per share. Source: Author estimates. = EXHIBIT 26.6 I Comparative Industry Data Annual growth rate of cash flow' Current Current Sales Last 5 Next 3-5 payout dividend ($ millions) years years ratio yield Debt Insider P/E equity? ownership ratio 28.4% 34.3% nmf 1,135 -1.5% 15.0% nmf 0% 2,512 941 1,702 1,244 1,357 2,058 3.0% 14.5% 0.0% 43.0% 8.5% 11.0% 10.5% 6.5% 10.0% 4.0% 4.5% 7.5% 0% 0% 0% 0% 0% 0% 0% 0% 0% 0% 0% 0% 33.7% 0.0% 26.1% 18.1% 68.7% 1.5% 1.0% 1.9% 3.2% 2.6% 1.4% 1.4% nmf 23.0 17.6 16.9 26.4 15.4 Rockboro Machine Tools Corp. CAD/CAM companies (software and hardware) Autodesk, Inc. Ansys, Inc. Cadence Design Mentor Graphics PTC Synopsys, Inc. Elect ndustr equipment manufacturers Emerson Electric Company Hubbell Inc. Rockwell Auto Machine tool manufacturers Actuant Corp. Lincoln Electric Holdings, Inc. Milacron, Inc. Snap-On Inc. 22,304 3,359 6,624 3.5% 7.5% 12.5% 3.5% 6.0% 5.5% 47% 37% 39% 3% 2% 2% 52.8% 31.0% 34.1% 0.8% 1.3% 1.5% 17.6 21.3 19.9 1,400 2.813 1,211 3,278 6.0% 11.5% nmf 9.5% 5.5% 3.5% nmf 8.5% 2% 24% 0% 26% 0.1% 1% 0% 2% 38.5% 0.2% 265.1% 39.1% 3.7% 3.3% 0.0% 3.4% 19.2 18.3 nmf 16.8 nmf = not a meaningful figure. Rockboro cash flow growth calculations use an adjusted cash flow for 2014 that omits the restructuring costs. 2 Based on book values. Current dividend yield Expected growth rate of sales (next 3-5 years) Current P/E ratio EXHIBIT 26.7 | Selected Healthy Companies with High- and Zero-Dividend Payouts Expected return Expected growth Current on total capital rate of dividends dividend Industry (next 3-5 years) (next 3-5 years) payout High-Payout Companies Pfizer Pharmaceutical 13.0% 6.0% 73.8% Suburban Propane Oil/gas pipeline_MLP? 8.0% 1.0% 212.1% CenturyLink, Inc. Telecommunications utility 5.5% 3.0% 86.4% Southern Company Electric utility 6.5% 3.0% 75.1% Dow Chemical Chemical manufacturing 10.5% 11.0% 46.0% Ford Motor Co. Auto manufacturer 7.5% 14.5% 43.1% Zero-Payout Companies AutoZone Auto parts 38.5% 0.0% 0.0% Popeyes Fried chicken fast food 21.0% 0.0% 0.0% Manhatttan Assoc Supply chain IT 27.5% 0.0% 0.0% Biogen Biotechnology 27.0% 0.0% 0.0% Sirius XM Entertainment radio 26.5% 0.0% 0.0% Amazon.com, Inc. Online retail 15.0% 0.0% 0.0% 3.6% 8.2% 6.7% 4.8% 4.6% 4.1% 1.5% 1.5% 3.0% 3.5% 7.0% 2.5% 21.1 24.5 12.8 16.5 12.4 8.3 0.0% 0.0% 0.0% 0.0% 0.0% 0.0% 12.8% 14.5% 10.0% 14.0% 8.5% 17.5% 19.7 28.8 50.1 16.6 26.4 nmf 1A master limited partnership (MLP) paid no corporate taxes. All income taxes were paid by shareholders on their share of taxable earnings. Data source: Value Line Investment Survey, August 2015. EXHIBIT 26.8 I Projected Sources-and-Uses Statement Assuming a 40% Payout Ratio 1 (dollars in millions) Assumptions: 2015 2016 2017 2018 2019 2020 2021 Sales Growth Rate: 15% 15% 15% 15% 15% 15% 15% Net Income as % of Sales 2.1% 4.0% 5.0% 5.5% 6.0% 6.5% 6.5% Dividend Payout Ratio 40.0% 40.0% 40.0% 40.0% 40.0% 40.0% 40.0% Projections Total 2015 2016 2017 2018 2019 2020 2021 2015-21 Sales $1,305 $1,501 $1,726 $1,985 $2,283 $2,625 $3,019 $14,444 Sources: Net income 27.0 60.0 86.3 109.2 137.0 170.6 196.2 786.4 Depreciation 33.9 39.0 44.9 51.6 59.4 68.3 78.5 375.6 Total 61.0 99.1 131.2 160.8 196.3 238.9 274.7 1,161.9 Uses: Capital expend. 65.3 75.0 86.3 99.3 102.7 118.1 135.9 682.6 Change in working capital 29.3 33.6 38.7 44.5 58.8 67.7 323.7 Total 94.5 108.7 125.0 143.7 153.9 177.0 203.5 1,006.3 Excess cash/(borrowing needs) (33.6) (9.6) 6.2 17.1 42.4 61.9 71.2 155.7 Dividend 10.8 24.0 34.5 43.7 54.8 68.3 78.5 314.6 After dividend Excess cash/(borrowing needs) ($44.4) ($33.6) ($28.3) ($26.6) ($12.3) ($6.3) ($7.3) ($158.9) 51.2 1This analysis ignores the effects of borrowing on interest expense. Source: Author estimates
Step by Step Solution
There are 3 Steps involved in it

Get step-by-step solutions from verified subject matter experts