Answered step by step
Verified Expert Solution
Question
1 Approved Answer
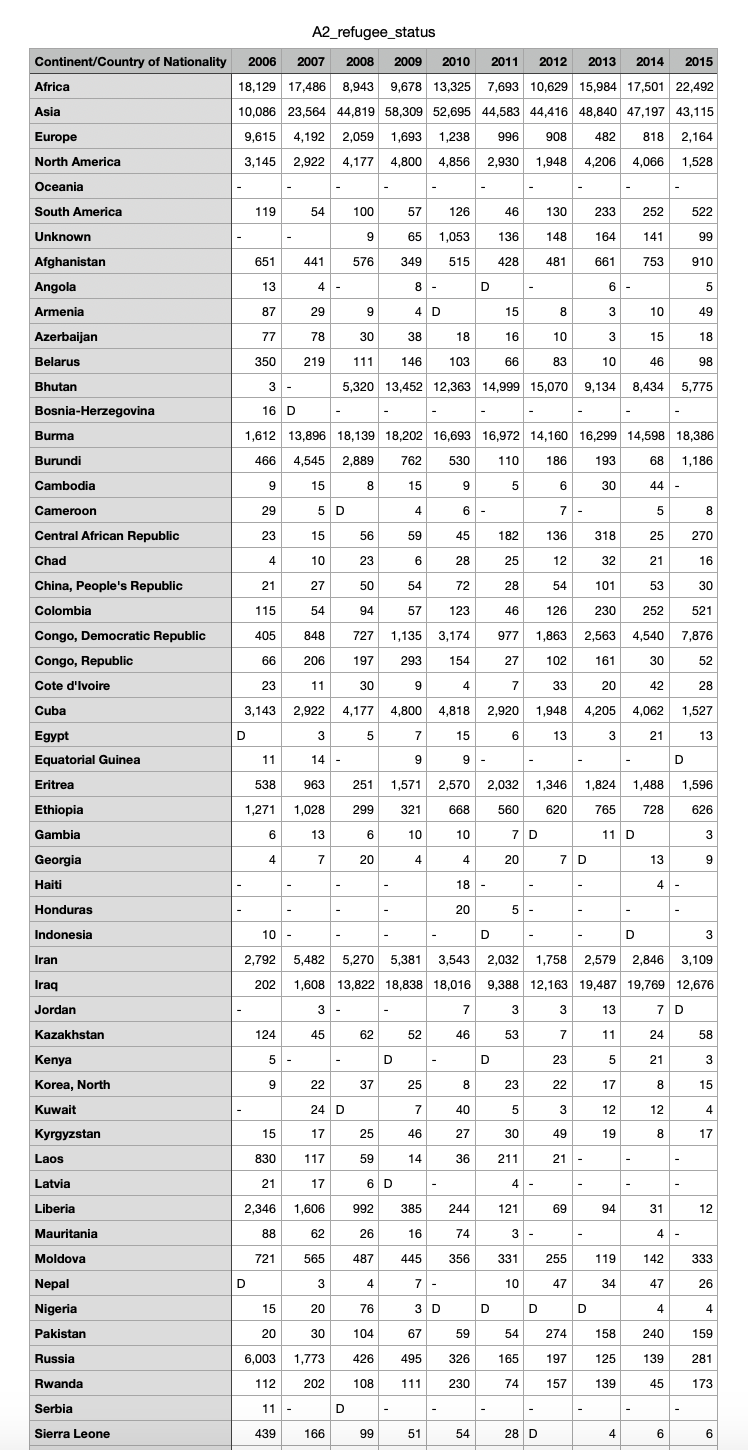
what story can i tell with graphs in Visualizing & Analyzing Data with R with the following dataset. this is the assignment i need the
what story can i tell with graphs in Visualizing & Analyzing Data with R with the following dataset. this is the assignment i need the story for: he United States has resettled more than refugees from different countries since
In this assignment, you will use R ggplot to explore where these refugees have come from. Feel free to use also graphical tools like InkscapeLinks to an external site..
Instructions
Heres what you need to do:
Use the Department of Homeland Securitys annual count of people granted refugee status between :
Arefugeestatus.csvDownload Arefugeestatus.csv
Create a new R Markdown file
Clean the data using the suggestions Ive given you below.
Summarize the data somehow. There is data for countries over years, so youll probably need to aggregate or reshape the data somehow unless you do a country sparkline Ive included some examples down below.
Create an appropriate timebased visualization based on the data. Dont just calculate overall averages or totals per countrythe visualization needs to deal with change over time. Do as much polishing and refining in Rmake adjustments to the colors, scales, labels, grid lines, and even fonts, etc. and this is that code i have: # Load required packageslibrarydplyrlibrarycountrycodelibrarylubridatelibrarytidyrlibrarytidyverse# Load the datadf read.csv~DocumentsR and RstudioA: RefugeesdataArefugeestatus.csv
refugeesraw readcsv~DocumentsR and RstudioA: RefugeesdataArefugeestatus.csv na cXDnoncountries cAfrica "Asia", "Europe", "North America", "Oceania", "South America", "Unknown", "Other", "Total"refugeesclean refugeesraw # Make this column name easier to work with renameorigincountry ContinentCountry of Nationality # Get rid of noncountries filterorigincountry in noncountries # Convert country names to ISO codes mutateiso countrycodeorigincountry, "country.name", "isoc custommatch cKorea North" PRK # Convert ISO codes to country names, regions, and continents mutateorigincountry countrycodeiso "isoc "country.name" originregion countrycodeiso "isoc "region" origincontinent countrycodeiso "isoc "continent" # Make this data tidy gatheryear number, origincountry, isooriginregion, origincontinent # Make sure the year column is numeric make an actual date column for years mutateyear asnumericyear yeardate ymdpasteyear
refugeesclean
refugeescountriescumulative refugeesclean arrangeyeardate groupbyorigincountry mutatecumulativetotal cumsumnumberrefugeescountriescumulative
refugeescontinents refugeesclean groupbyorigincontinent, yeardate summarizetotal sumnumber narm TRUE
refugeescontinentscumulative refugeesclean groupbyorigincontinent, yeardate summarizetotal sumnumber narm TRUE arrangeyeardate groupbyorigincontinent mutatecumulativetotal cumsumtotal

Step by Step Solution
There are 3 Steps involved in it
Step: 1

Get Instant Access to Expert-Tailored Solutions
See step-by-step solutions with expert insights and AI powered tools for academic success
Step: 2

Step: 3

Ace Your Homework with AI
Get the answers you need in no time with our AI-driven, step-by-step assistance
Get Started


