- What was Target's inventory turnover ratio and average days to sell inventory for the fiscal year ended February 2, 2019, 2018, and 2017.
- Is the company's management of inventory getting better or worse?
- What cost flow method(s) did Target use to account for inventory?
- Based on the information, would you recommend any actions for Target to consider?
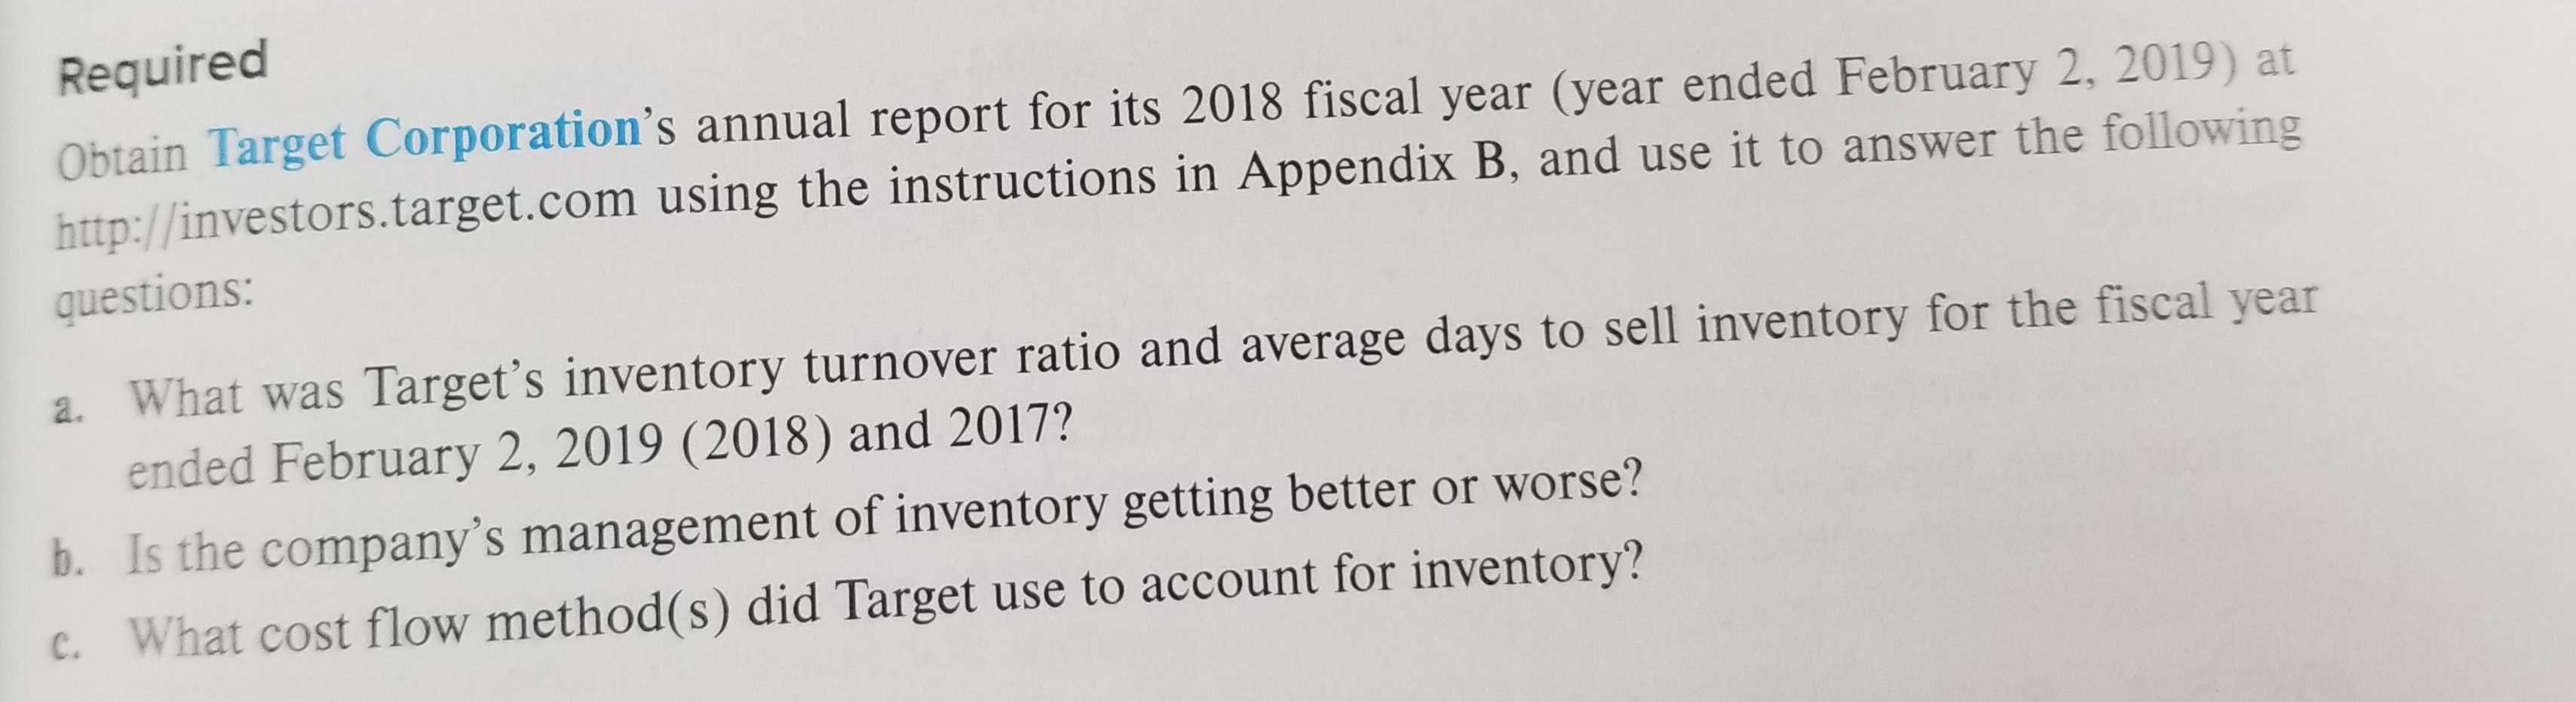
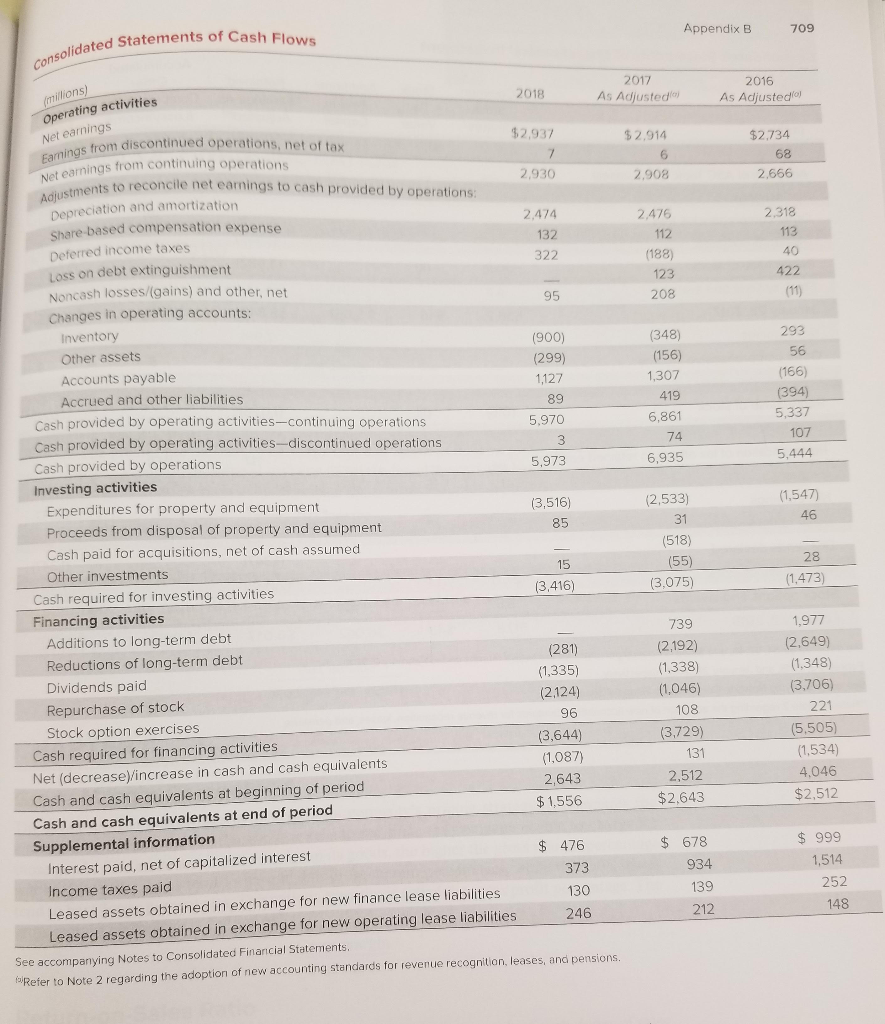
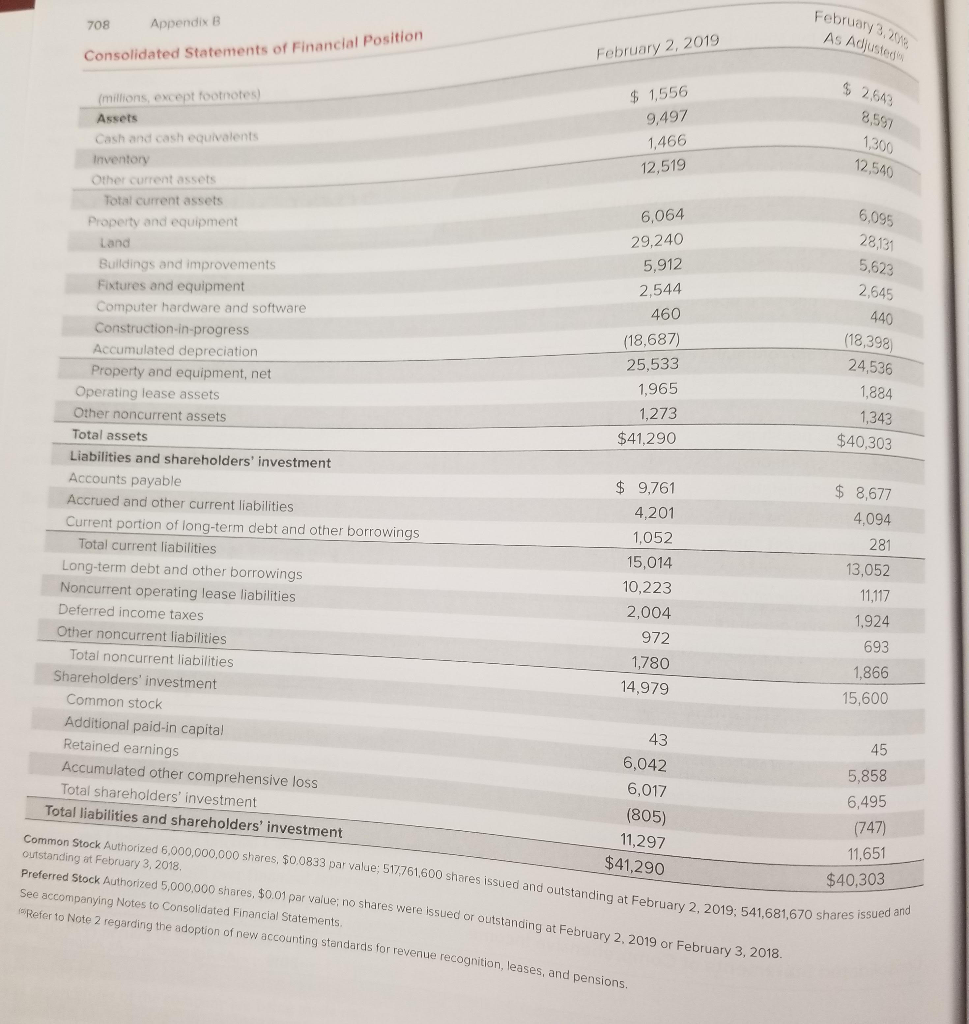
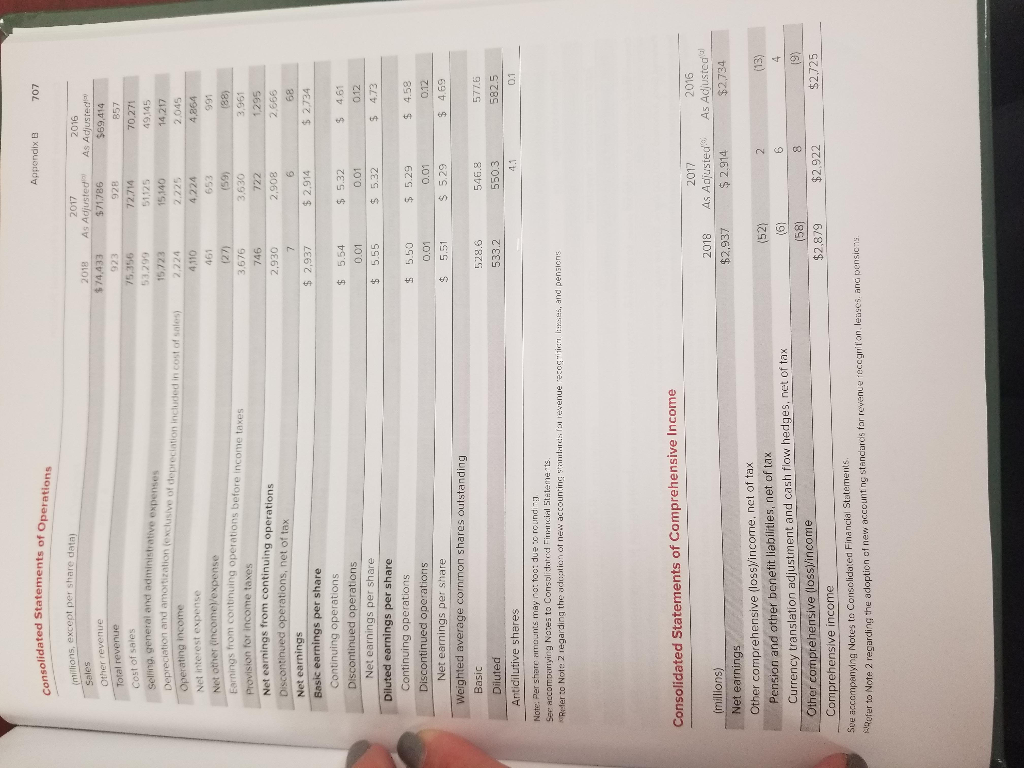
Required Obtain Target Corporation's annual report for its 2018 fiscal year (year ended February 2, 2019) at http://investors.target.com using the instructions in Appendix B, and use it to answer the following questions: a. What was Target's inventory turnover ratio and average days to sell inventory for the fiscal year ended February 2, 2019 (2018) and 2017? b. Is the company's management of inventory getting better or worse? c. What cost flow method(s) did Target use to account for inventory? millions) Operating activities Net earnings consolidated Statements of Cash Flows Earnings from discontinued operations, net of tax Net earnings from continuing operations Adjustments to reconcile net earnings to cash provided by operations: Appendix B 709 2017 2016 2018 As Adjusted As Adjusted $2,937 $2.914 $2,734 7 6 68 2,930 2.908 2.666 Depreciation and amortization 2,474 2.476 2.318 Share-based compensation expense 132 112 113 Deferred income taxes 322 (188) 40 Loss on debt extinguishment 123 422 Noncash losses/(gains) and other, net 95 208 (11) Changes in operating accounts: Inventory (900) (348 293 Other assets (299) (156) 56 Accounts payable 1,127 1,307 (166) Accrued and other liabilities 89 419 (394) Cash provided by operating activities-continuing operations 5.970 6.861 5,337 Cash provided by operating activities-discontinued operations 3 74 107 Cash provided by operations 5,973 6,935 5.444 Investing activities Expenditures for property and equipment (3,516 (2.533) (1,547) Proceeds from disposal of property and equipment 85 31 46 Cash paid for acquisitions, net of cash assumed (518) Other investments 15 (55) 28 Cash required for investing activities (3,416) (3,075) (1.473) Financing activities 739 Additions to long-term debt 1.977 (281) Reductions of long-term debt (2,192) (2,649) (1,335) Dividends paid (1,338) (1.348 (2.124) (1,046) (3,706 Repurchase of stock 96 108 221 Stock option exercises (3,644) (3,729) (5.505) Cash required for financing activities (1,087) 131 (1,534) Net (decrease)/increase in cash and cash equivalents 2,643 2,512 4.046 Cash and cash equivalents at beginning of period $1,556 $2.643 $2,512 Cash and cash equivalents at end of period Supplemental information $ 476 $ 678 $ 999 Interest paid, net of capitalized interest 373 934 1,514 Income taxes paid 130 139 252 Leased assets obtained in exchange for new finance lease liabilities 246 212 148 Leased assets obtained in exchange for new operating lease liabilities See accompanying Notes to Consolidated Financial Statements Refer to Note 2 regarding the adoption of new accounting standards for revenue recognition, leases, and pensions. 708 Appendix B Consolidated Statements of Financial Position February 3.2003 As Adjusted February 2, 2019 $ 1,556 9,497 1,466 12,519 $ 2,543 8,597 1,300 12,540 6,064 6,095 28131 5,623 2,645 440 (millions, except footnotes) Assets Cash and cash equivalents Inventory Other current assets. Total current assets Property and equipment Land Buildings and improvements Fixtures and equipment Computer hardware and software Construction-in-progress Accumulated depreciation Property and equipment, net Operating lease assets Other noncurrent assets Total assets Liabilities and shareholders' investment Accounts payable Accrued and other current liabilities Current portion of long-term debt and other borrowings Total current liabilities Long-term debt and other borrowings Noncurrent operating lease liabilities Deferred income taxes Other noncurrent liabilities Total noncurrent liabilities Shareholders' investment Common stock Additional paid-in capital 29,240 5,912 2,544 460 (18,687) 25,533 1,965 1,273 $41,290 (18,398 24,536 1,884 1,343 $40,303 $ 9,761 4,201 1,052 15,014 10,223 2,004 972 1,780 14,979 $ 8,677 4,094 281 13,052 11,117 1,924 693 1,866 15,600 43 6,042 Retained earnings 6,017 Accumulated other comprehensive loss (805) Total shareholders' investment 11,297 Total liabilities and shareholders' investment $41,290 common Stock Authorized 6,000,000,000 shares, $0.9833 par value; 51761,600 shares issued and outstanding at February 2, 2019; 541,681,670 shares isued ano outstanding at February 3, 2018 Preferred Stock Authorized 5,000,000 shares, $0.01 par value, no shares were issued or outstanding at February 2, 2019 or February 3, 2018 See accompanying Notes to Consolidated Financial Statements Refer to Note 2 regarding the adoption of new accounting standards for revenue recognition, leases, and pensions. 45 5,858 6,495 (747) 11,651 $40,303 Consolidated Statements of Operations sem general and administrative expenses 4220 Appendix B 707 (millions, except per share data) Cales Sales Other revenue revenue C Cost of sales 2017 As Adjusted $71786 928 72,714 Totale 2018 $74,433 923 75,356 53.299 15,723 2.224 4110 1110 161 2016 As Adjusted $69,414 857 70,271 49,145 14,217 2.045 4,264 15,140 2,225 653 (59) 3,630 3,676 746 2,930 722 2.908 6 $ 2.914 (88) 3,961 1295 2.666 68 $ 2,734 $ 2,937 De Operating income Depreciation and amortization (exclusive of depreciation included in cost of sales) Net interest expense Net other (income)/expense Provision for income taxes Earnings from continuing operations before income taxes Net earnings from continuing operations Discontinued operations, net of tax Net earnings Basic earnings per share Continuing operations Discontinued operations Net earnings per share Diluted earnings per share Continuing operations Discontinued operations Net earnings per Share Weighted average common shares outstanding Basic Diluted Antidilutive shares $ 5.54 0.01 $ 5.55 $ 5.32 0.01 $ 5.32 0.12 $ 4.73 $ 5.50 0.01 $ 5.51 $ 5.29 0.01 $ 4.58 0.12 $ 4.69 $ 5.29 528.6 533.2 546.8 550.3 4.1 577.6 582.5 0.1 Note: Per share amounts may not too: due o rounding See accompanying Notes to Consolidated Financial Statements. "Refer to Note 2 regarding the adoption of new accounting and for revenue recolth, and pensions Consolidated Statements of Comprehensive Income 2017 As Adjusted $ 2.914 2016 As Adjusted $2734 (millions) 2018 Net earnings $2.937 Other comprehensive (lossy'income, net of tax Pension and other benefit liabilities, net of tax (52) Currency translation adjustment and cash flow hedges, net of tax (61 Other comprehensive (loss)/income (58) $2,879 Comprehensive income Sve accompanying Notes to Consolidated Financial Statements. Rofer to Note 2 regarding the adoption of new account ng standards for revenue recognition leases, and pensions. 2 6 (13) 4 8 $2,922 192 $2,725 Required Obtain Target Corporation's annual report for its 2018 fiscal year (year ended February 2, 2019) at http://investors.target.com using the instructions in Appendix B, and use it to answer the following questions: a. What was Target's inventory turnover ratio and average days to sell inventory for the fiscal year ended February 2, 2019 (2018) and 2017? b. Is the company's management of inventory getting better or worse? c. What cost flow method(s) did Target use to account for inventory? millions) Operating activities Net earnings consolidated Statements of Cash Flows Earnings from discontinued operations, net of tax Net earnings from continuing operations Adjustments to reconcile net earnings to cash provided by operations: Appendix B 709 2017 2016 2018 As Adjusted As Adjusted $2,937 $2.914 $2,734 7 6 68 2,930 2.908 2.666 Depreciation and amortization 2,474 2.476 2.318 Share-based compensation expense 132 112 113 Deferred income taxes 322 (188) 40 Loss on debt extinguishment 123 422 Noncash losses/(gains) and other, net 95 208 (11) Changes in operating accounts: Inventory (900) (348 293 Other assets (299) (156) 56 Accounts payable 1,127 1,307 (166) Accrued and other liabilities 89 419 (394) Cash provided by operating activities-continuing operations 5.970 6.861 5,337 Cash provided by operating activities-discontinued operations 3 74 107 Cash provided by operations 5,973 6,935 5.444 Investing activities Expenditures for property and equipment (3,516 (2.533) (1,547) Proceeds from disposal of property and equipment 85 31 46 Cash paid for acquisitions, net of cash assumed (518) Other investments 15 (55) 28 Cash required for investing activities (3,416) (3,075) (1.473) Financing activities 739 Additions to long-term debt 1.977 (281) Reductions of long-term debt (2,192) (2,649) (1,335) Dividends paid (1,338) (1.348 (2.124) (1,046) (3,706 Repurchase of stock 96 108 221 Stock option exercises (3,644) (3,729) (5.505) Cash required for financing activities (1,087) 131 (1,534) Net (decrease)/increase in cash and cash equivalents 2,643 2,512 4.046 Cash and cash equivalents at beginning of period $1,556 $2.643 $2,512 Cash and cash equivalents at end of period Supplemental information $ 476 $ 678 $ 999 Interest paid, net of capitalized interest 373 934 1,514 Income taxes paid 130 139 252 Leased assets obtained in exchange for new finance lease liabilities 246 212 148 Leased assets obtained in exchange for new operating lease liabilities See accompanying Notes to Consolidated Financial Statements Refer to Note 2 regarding the adoption of new accounting standards for revenue recognition, leases, and pensions. 708 Appendix B Consolidated Statements of Financial Position February 3.2003 As Adjusted February 2, 2019 $ 1,556 9,497 1,466 12,519 $ 2,543 8,597 1,300 12,540 6,064 6,095 28131 5,623 2,645 440 (millions, except footnotes) Assets Cash and cash equivalents Inventory Other current assets. Total current assets Property and equipment Land Buildings and improvements Fixtures and equipment Computer hardware and software Construction-in-progress Accumulated depreciation Property and equipment, net Operating lease assets Other noncurrent assets Total assets Liabilities and shareholders' investment Accounts payable Accrued and other current liabilities Current portion of long-term debt and other borrowings Total current liabilities Long-term debt and other borrowings Noncurrent operating lease liabilities Deferred income taxes Other noncurrent liabilities Total noncurrent liabilities Shareholders' investment Common stock Additional paid-in capital 29,240 5,912 2,544 460 (18,687) 25,533 1,965 1,273 $41,290 (18,398 24,536 1,884 1,343 $40,303 $ 9,761 4,201 1,052 15,014 10,223 2,004 972 1,780 14,979 $ 8,677 4,094 281 13,052 11,117 1,924 693 1,866 15,600 43 6,042 Retained earnings 6,017 Accumulated other comprehensive loss (805) Total shareholders' investment 11,297 Total liabilities and shareholders' investment $41,290 common Stock Authorized 6,000,000,000 shares, $0.9833 par value; 51761,600 shares issued and outstanding at February 2, 2019; 541,681,670 shares isued ano outstanding at February 3, 2018 Preferred Stock Authorized 5,000,000 shares, $0.01 par value, no shares were issued or outstanding at February 2, 2019 or February 3, 2018 See accompanying Notes to Consolidated Financial Statements Refer to Note 2 regarding the adoption of new accounting standards for revenue recognition, leases, and pensions. 45 5,858 6,495 (747) 11,651 $40,303 Consolidated Statements of Operations sem general and administrative expenses 4220 Appendix B 707 (millions, except per share data) Cales Sales Other revenue revenue C Cost of sales 2017 As Adjusted $71786 928 72,714 Totale 2018 $74,433 923 75,356 53.299 15,723 2.224 4110 1110 161 2016 As Adjusted $69,414 857 70,271 49,145 14,217 2.045 4,264 15,140 2,225 653 (59) 3,630 3,676 746 2,930 722 2.908 6 $ 2.914 (88) 3,961 1295 2.666 68 $ 2,734 $ 2,937 De Operating income Depreciation and amortization (exclusive of depreciation included in cost of sales) Net interest expense Net other (income)/expense Provision for income taxes Earnings from continuing operations before income taxes Net earnings from continuing operations Discontinued operations, net of tax Net earnings Basic earnings per share Continuing operations Discontinued operations Net earnings per share Diluted earnings per share Continuing operations Discontinued operations Net earnings per Share Weighted average common shares outstanding Basic Diluted Antidilutive shares $ 5.54 0.01 $ 5.55 $ 5.32 0.01 $ 5.32 0.12 $ 4.73 $ 5.50 0.01 $ 5.51 $ 5.29 0.01 $ 4.58 0.12 $ 4.69 $ 5.29 528.6 533.2 546.8 550.3 4.1 577.6 582.5 0.1 Note: Per share amounts may not too: due o rounding See accompanying Notes to Consolidated Financial Statements. "Refer to Note 2 regarding the adoption of new accounting and for revenue recolth, and pensions Consolidated Statements of Comprehensive Income 2017 As Adjusted $ 2.914 2016 As Adjusted $2734 (millions) 2018 Net earnings $2.937 Other comprehensive (lossy'income, net of tax Pension and other benefit liabilities, net of tax (52) Currency translation adjustment and cash flow hedges, net of tax (61 Other comprehensive (loss)/income (58) $2,879 Comprehensive income Sve accompanying Notes to Consolidated Financial Statements. Rofer to Note 2 regarding the adoption of new account ng standards for revenue recognition leases, and pensions. 2 6 (13) 4 8 $2,922 192 $2,725