Answered step by step
Verified Expert Solution
Link Copied!

Question

1 Approved Answer

What were the total imports and exports for the U.S. last year? The data is monthly but you can find cumulative annual trade data in

What were the total imports and exports for the U.S. last year? The data is monthly but you can find cumulative annual trade data in the report in the Exhibit 1. For example, U.S. Goods and services exports in 2022: $1.515 trillion; imports in 2022: $1.924 trillion.
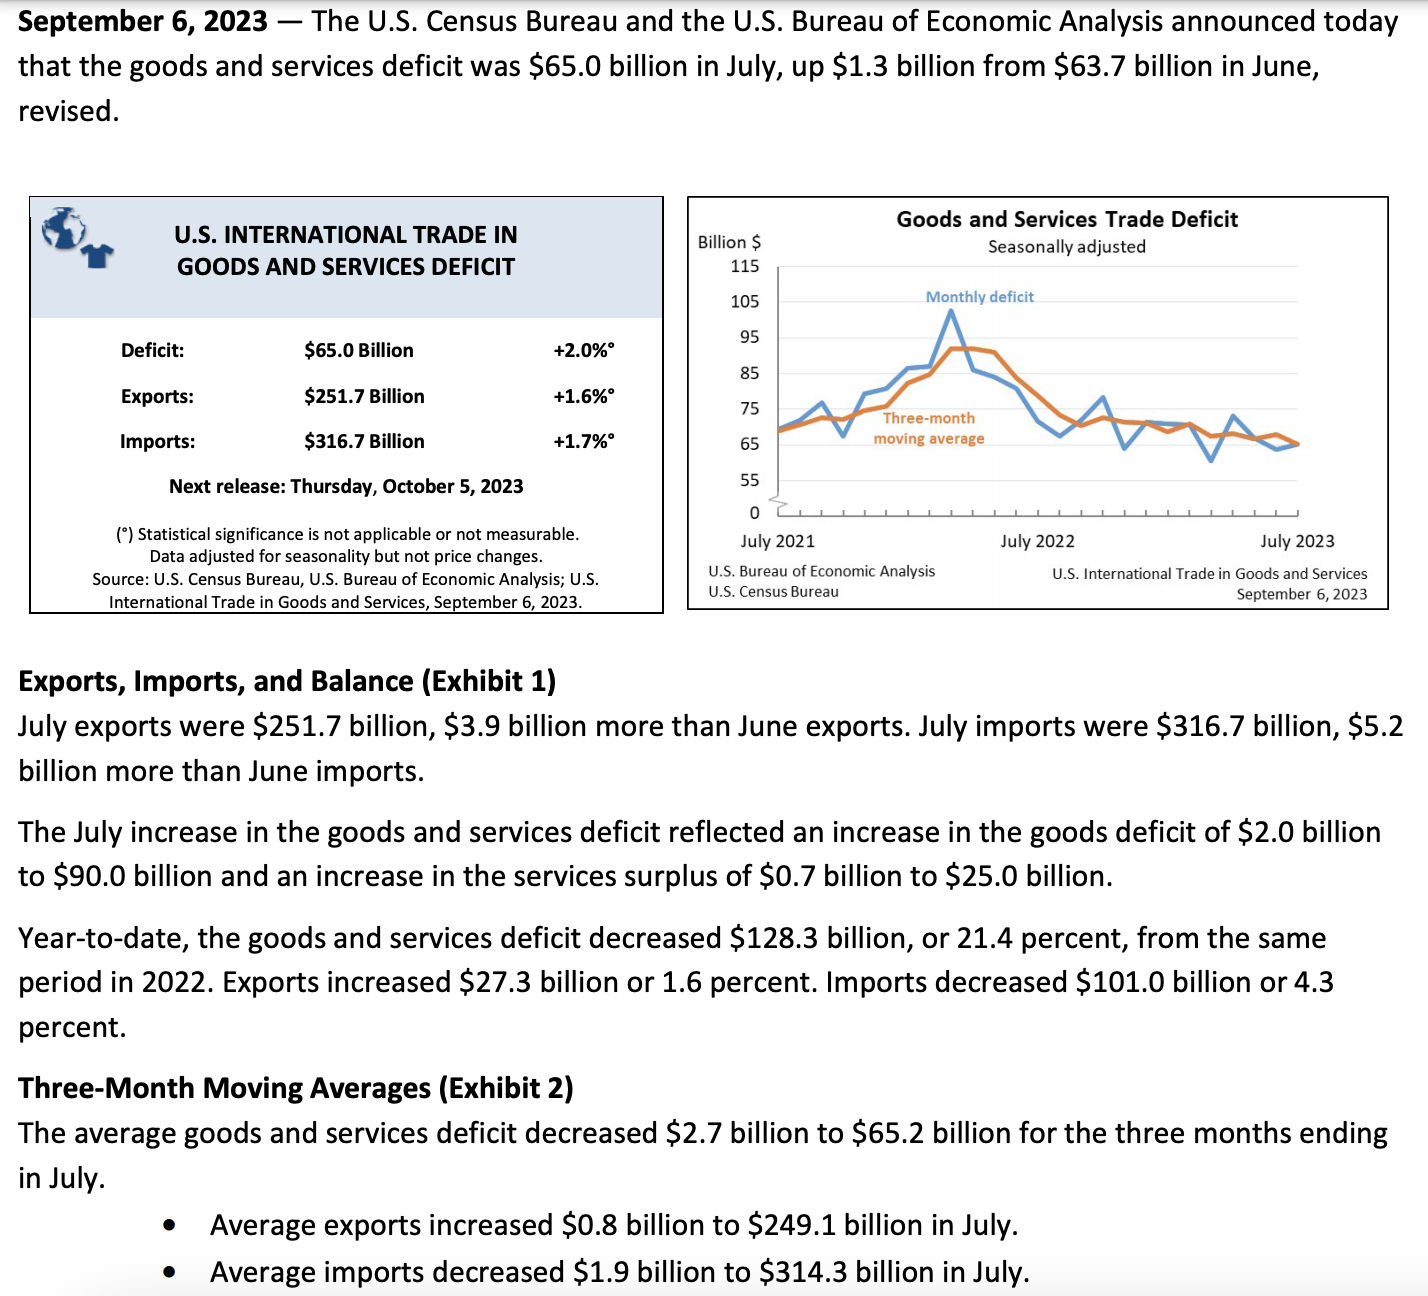
image text in transcribed

September 6,2023 - The U.S. Census Bureau and the U.S. Bureau of Economic Analysis announced today that the goods and services deficit was $65.0 billion in July, up $1.3 billion from $63.7 billion in June, revised. Exports, Imports, and Balance (Exhibit 1) July exports were $251.7 billion, $3.9 billion more than June exports. July imports were $316.7 billion, $5.2 billion more than June imports. The July increase in the goods and services deficit reflected an increase in the goods deficit of $2.0 billion to $90.0 billion and an increase in the services surplus of $0.7 billion to $25.0 billion. Year-to-date, the goods and services deficit decreased \$128.3 billion, or 21.4 percent, from the same period in 2022. Exports increased $27.3 billion or 1.6 percent. Imports decreased $101.0 billion or 4.3 percent. Three-Month Moving Averages (Exhibit 2) The average goods and services deficit decreased $2.7 billion to $65.2 billion for the three months ending in July. - Average exports increased $0.8 billion to $249.1 billion in July. - Average imports decreased $1.9 billion to $314.3 billion in July. September 6,2023 - The U.S. Census Bureau and the U.S. Bureau of Economic Analysis announced today that the goods and services deficit was $65.0 billion in July, up $1.3 billion from $63.7 billion in June, revised. Exports, Imports, and Balance (Exhibit 1) July exports were $251.7 billion, $3.9 billion more than June exports. July imports were $316.7 billion, $5.2 billion more than June imports. The July increase in the goods and services deficit reflected an increase in the goods deficit of $2.0 billion to $90.0 billion and an increase in the services surplus of $0.7 billion to $25.0 billion. Year-to-date, the goods and services deficit decreased \$128.3 billion, or 21.4 percent, from the same period in 2022. Exports increased $27.3 billion or 1.6 percent. Imports decreased $101.0 billion or 4.3 percent. Three-Month Moving Averages (Exhibit 2) The average goods and services deficit decreased $2.7 billion to $65.2 billion for the three months ending in July. - Average exports increased $0.8 billion to $249.1 billion in July. - Average imports decreased $1.9 billion to $314.3 billion in July

Step by Step Solution

There are 3 Steps involved in it

Step: 1

blur-text-image

Get Instant Access to Expert-Tailored Solutions

See step-by-step solutions with expert insights and AI powered tools for academic success

Step: 2

blur-text-image

Step: 3

blur-text-image

Ace Your Homework with AI

Get the answers you need in no time with our AI-driven, step-by-step assistance

Get Started

Recommended Textbook for

Multi Level Finance And The Euro Crisis Causes And Effects

Authors: Ehtisham Ahmad, Massimo BordignonA, Giorgio Brosio

1st Edition

1784715107, 978-1784715106

More Books

Students also viewed these Finance questions