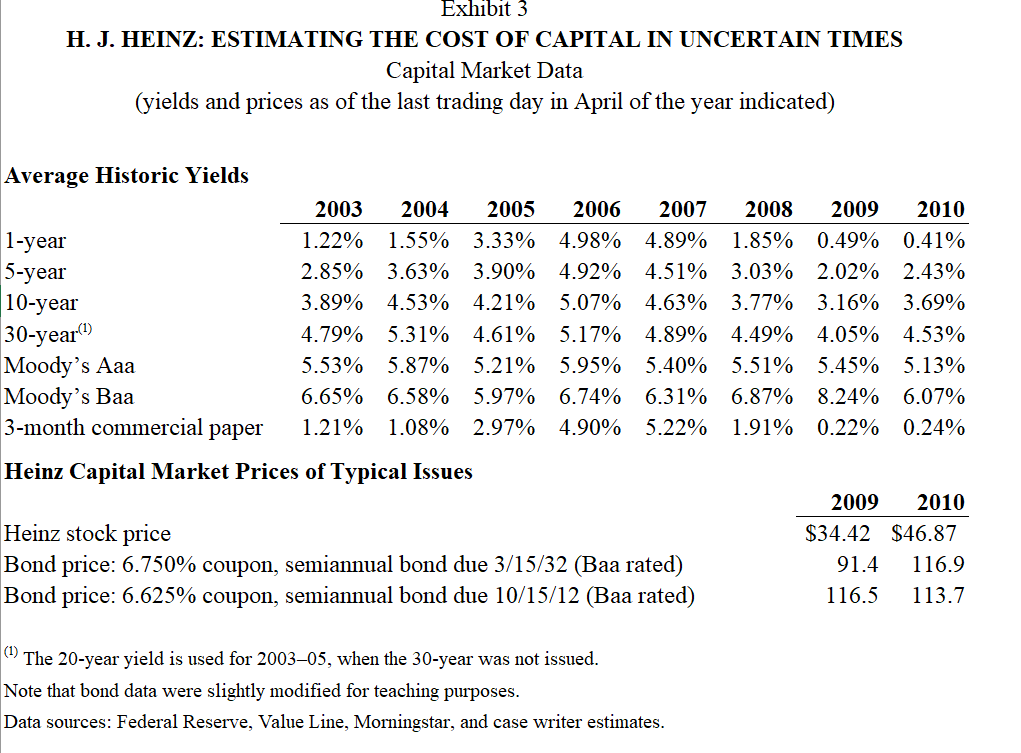
What were the yields on the two representative outstanding Heinz-debt issues as of the end of April 2010? What were they one year earlier?
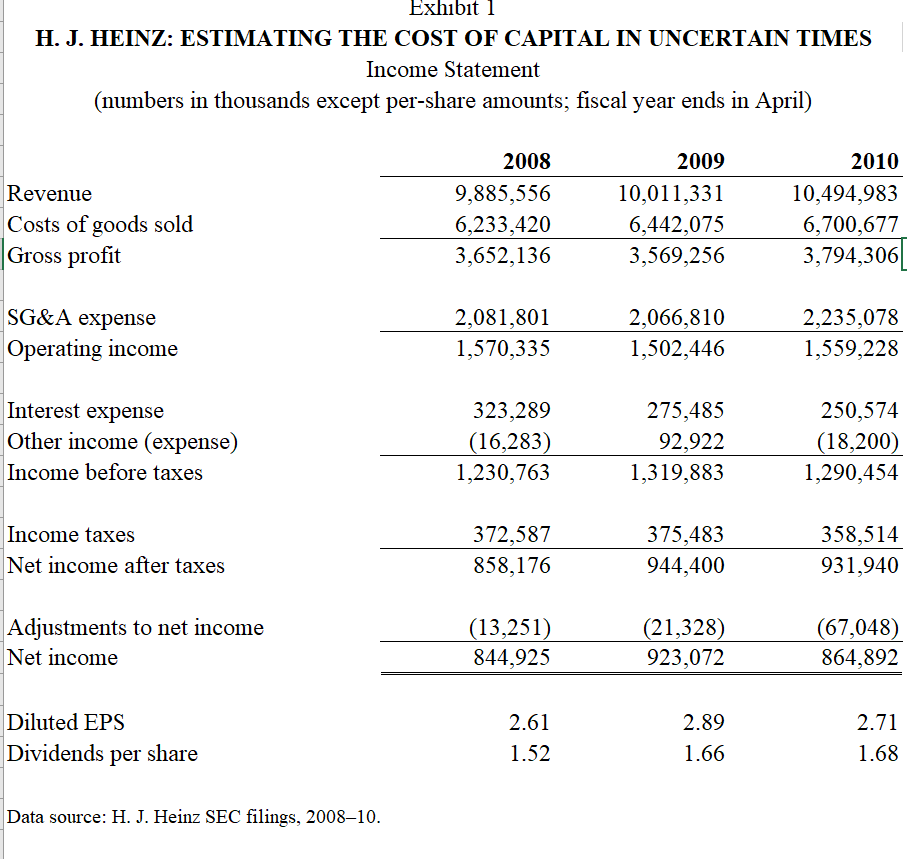
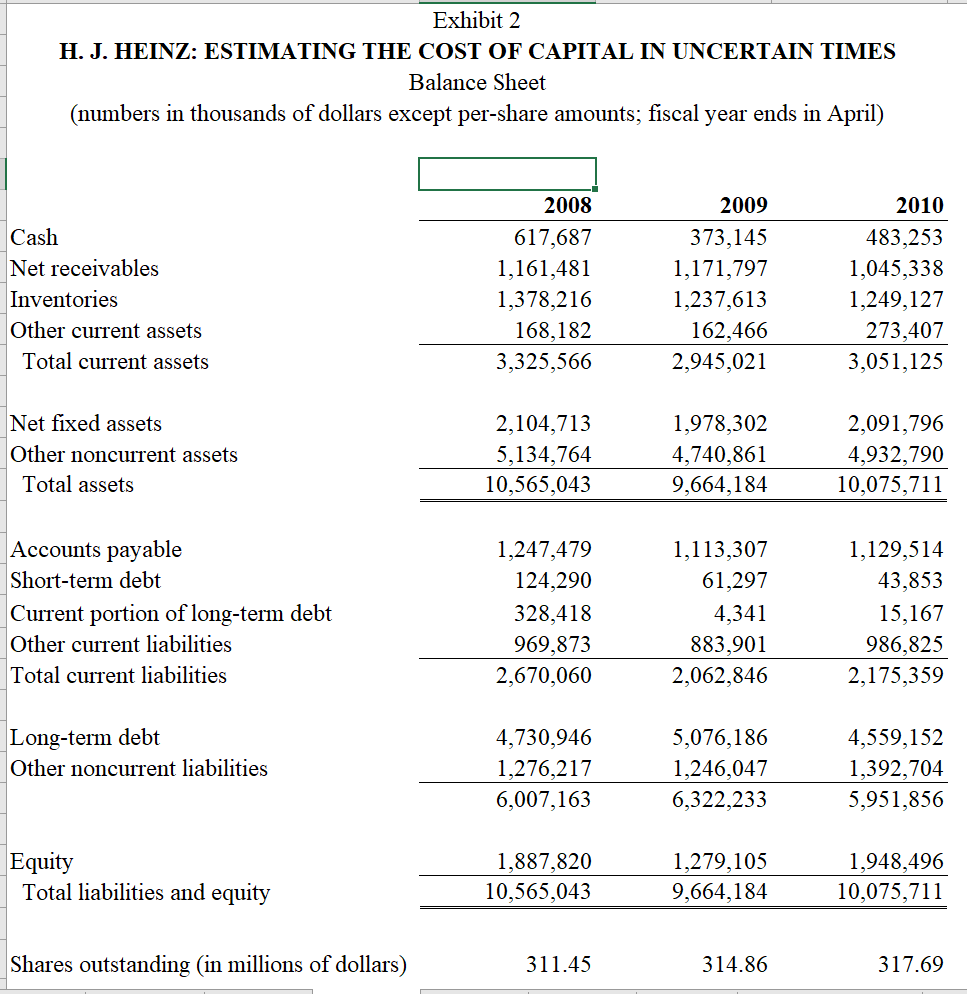
What was the WACC for Heinz at the start of the fiscal year 2010? What was the WACC one year earlier?
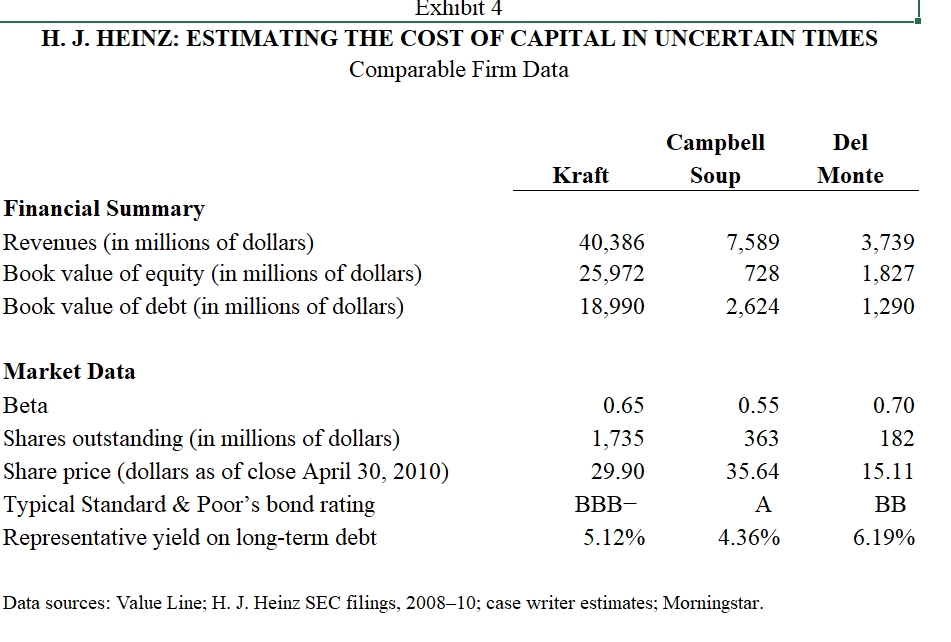
What is your best estimate of the WACC for Kraft Foods, Campbell Soup Company, and Del Monte Foods? How do these WACCs influence your thinking about the WACC for Heinz?
all info is in pics
Exhibit 1 H. J. HEINZ: ESTIMATING THE COST OF CAPITAL IN UNCERTAIN TIMES Income Statement (numbers in thousands except per-share amounts; fiscal year ends in April) Revenue Costs of goods sold Gross profit 2008 9,885,556 6,233,420 3,652,136 2009 10,011,331 6,442,075 3,569,256 2010 10,494,983 6,700,677 3,794,306 SG&A expense 2,081,801 1,570,335 2,066,810 1,502,446 2,235,078 1,559,228 Operating income Interest expense Other income (expense) Income before taxes 323,289 (16,283) 1,230,763 275,485 92,922 1,319,883 250,574 (18,200) 1,290,454 Income taxes Net income after taxes 372,587 858,176 375,483 944,400 358,514 931,940 Adjustments to net income Net income (13,251) 844,925 (21,328) 923,072 (67,048) 864,892 Diluted EPS Dividends per share 2.61 1.52 2.89 1.66 2.71 1.68 Data source: H. J. Heinz SEC filings, 200810. Exhibit 2 H. J. HEINZ: ESTIMATING THE COST OF CAPITAL IN UNCERTAIN TIMES Balance Sheet (numbers in thousands of dollars except per-share amounts; fiscal year ends in April) Cash Net receivables Inventories Other current assets Total current assets 2008 617,687 1,161,481 1,378,216 168,182 3,325,566 2009 373,145 1,171,797 1,237,613 162,466 2,945,021 2010 483,253 1,045,338 1,249,127 273,407 3,051,125 Net fixed assets Other noncurrent assets Total assets 2,104,713 5,134,764 10,565,043 1,978,302 4,740,861 9,664,184 2,091,796 4,932,790 10,075,711 Accounts payable Short-term debt Current portion of long-term debt Other current liabilities Total current liabilities 1,247,479 124,290 328,418 969,873 2,670,060 1,113,307 61,297 4,341 883,901 2,062,846 1,129,514 43,853 15,167 986,825 2,175,359 Long-term debt Other noncurrent liabilities 4,730,946 1,276,217 6,007,163 5,076,186 1,246,047 6,322,233 4,559,152 1,392,704 5,951,856 Equity Total liabilities and equity 1,887,820 10,565,043 1,279,105 9,664,184 1,948,496 10,075,711 Shares outstanding (in millions of dollars) 311.45 314.86 317.69 Exhibit 3 H. J. HEINZ: ESTIMATING THE COST OF CAPITAL IN UNCERTAIN TIMES Capital Market Data (yields and prices as of the last trading day in April of the year indicated) Average Historic Yields 2003 2004 2005 2006 2007 2008 2009 2010 1-year 1.22% 1.55% 3.33% 4.98% 4.89% 1.85% 0.49% 0.41% 5-year 2.85% 3.63% 3.90% 4.92% 4.51% 3.03% 2.02% 2.43% 10-year 3.89% 4.53% 4.21% 5.07% 4.63% 3.77% 3.16% 3.69% 30-year) 4.79% 5.31% 4.61% 5.17% 4.89% 4.49% 4.05% 4.53% Moody's Aaa 5.53% 5.87% 5.21% 5.95% 5.40% 5.51% 5.45% 5.13% Moody's Baa 6.65% 6.58% 5.97% 6.74% 6.31% 6.87% 8.24% 6.07% 3-month commercial paper 1.21% 1.08% 2.97% 4.90% 5.22% 1.91% 0.22% 0.24% Heinz Capital Market Prices of Typical Issues 2009 2010 Heinz stock price $34.42 $46.87 Bond price: 6.750% coupon, semiannual bond due 3/15/32 (Baa rated) 116.9 Bond price: 6.625% coupon, semiannual bond due 10/15/12 (Baa rated) 116.5 113.7 91.4 (1) The 20-year yield is used for 200305, when the 30-year was not issued. Note that bond data were slightly modified for teaching purposes. Data sources: Federal Reserve, Value Line, Morningstar, and case writer estimates. Exhibit 4 H. J. HEINZ: ESTIMATING THE COST OF CAPITAL IN UNCERTAIN TIMES Comparable Firm Data Campbell Soup Del Monte Kraft Financial Summary Revenues (in millions of dollars) Book value of equity (in millions of dollars) Book value of debt (in millions of dollars) 40,386 25,972 18,990 7,589 728 2,624 3,739 1,827 1,290 0.65 Market Data Beta Shares outstanding (in millions of dollars) Share price (dollars as of close April 30, 2010) Typical Standard & Poor's bond rating Representative yield on long-term debt 0.55 363 35.64 1,735 29.90 BBB- 5.12% 0.70 182 15.11 BB A 4.36% 6.19% Data sources: Value Line; H. J. Heinz SEC filings, 200810; case writer estimates; Morningstar. Exhibit 1 H. J. HEINZ: ESTIMATING THE COST OF CAPITAL IN UNCERTAIN TIMES Income Statement (numbers in thousands except per-share amounts; fiscal year ends in April) Revenue Costs of goods sold Gross profit 2008 9,885,556 6,233,420 3,652,136 2009 10,011,331 6,442,075 3,569,256 2010 10,494,983 6,700,677 3,794,306 SG&A expense 2,081,801 1,570,335 2,066,810 1,502,446 2,235,078 1,559,228 Operating income Interest expense Other income (expense) Income before taxes 323,289 (16,283) 1,230,763 275,485 92,922 1,319,883 250,574 (18,200) 1,290,454 Income taxes Net income after taxes 372,587 858,176 375,483 944,400 358,514 931,940 Adjustments to net income Net income (13,251) 844,925 (21,328) 923,072 (67,048) 864,892 Diluted EPS Dividends per share 2.61 1.52 2.89 1.66 2.71 1.68 Data source: H. J. Heinz SEC filings, 200810. Exhibit 2 H. J. HEINZ: ESTIMATING THE COST OF CAPITAL IN UNCERTAIN TIMES Balance Sheet (numbers in thousands of dollars except per-share amounts; fiscal year ends in April) Cash Net receivables Inventories Other current assets Total current assets 2008 617,687 1,161,481 1,378,216 168,182 3,325,566 2009 373,145 1,171,797 1,237,613 162,466 2,945,021 2010 483,253 1,045,338 1,249,127 273,407 3,051,125 Net fixed assets Other noncurrent assets Total assets 2,104,713 5,134,764 10,565,043 1,978,302 4,740,861 9,664,184 2,091,796 4,932,790 10,075,711 Accounts payable Short-term debt Current portion of long-term debt Other current liabilities Total current liabilities 1,247,479 124,290 328,418 969,873 2,670,060 1,113,307 61,297 4,341 883,901 2,062,846 1,129,514 43,853 15,167 986,825 2,175,359 Long-term debt Other noncurrent liabilities 4,730,946 1,276,217 6,007,163 5,076,186 1,246,047 6,322,233 4,559,152 1,392,704 5,951,856 Equity Total liabilities and equity 1,887,820 10,565,043 1,279,105 9,664,184 1,948,496 10,075,711 Shares outstanding (in millions of dollars) 311.45 314.86 317.69 Exhibit 3 H. J. HEINZ: ESTIMATING THE COST OF CAPITAL IN UNCERTAIN TIMES Capital Market Data (yields and prices as of the last trading day in April of the year indicated) Average Historic Yields 2003 2004 2005 2006 2007 2008 2009 2010 1-year 1.22% 1.55% 3.33% 4.98% 4.89% 1.85% 0.49% 0.41% 5-year 2.85% 3.63% 3.90% 4.92% 4.51% 3.03% 2.02% 2.43% 10-year 3.89% 4.53% 4.21% 5.07% 4.63% 3.77% 3.16% 3.69% 30-year) 4.79% 5.31% 4.61% 5.17% 4.89% 4.49% 4.05% 4.53% Moody's Aaa 5.53% 5.87% 5.21% 5.95% 5.40% 5.51% 5.45% 5.13% Moody's Baa 6.65% 6.58% 5.97% 6.74% 6.31% 6.87% 8.24% 6.07% 3-month commercial paper 1.21% 1.08% 2.97% 4.90% 5.22% 1.91% 0.22% 0.24% Heinz Capital Market Prices of Typical Issues 2009 2010 Heinz stock price $34.42 $46.87 Bond price: 6.750% coupon, semiannual bond due 3/15/32 (Baa rated) 116.9 Bond price: 6.625% coupon, semiannual bond due 10/15/12 (Baa rated) 116.5 113.7 91.4 (1) The 20-year yield is used for 200305, when the 30-year was not issued. Note that bond data were slightly modified for teaching purposes. Data sources: Federal Reserve, Value Line, Morningstar, and case writer estimates. Exhibit 4 H. J. HEINZ: ESTIMATING THE COST OF CAPITAL IN UNCERTAIN TIMES Comparable Firm Data Campbell Soup Del Monte Kraft Financial Summary Revenues (in millions of dollars) Book value of equity (in millions of dollars) Book value of debt (in millions of dollars) 40,386 25,972 18,990 7,589 728 2,624 3,739 1,827 1,290 0.65 Market Data Beta Shares outstanding (in millions of dollars) Share price (dollars as of close April 30, 2010) Typical Standard & Poor's bond rating Representative yield on long-term debt 0.55 363 35.64 1,735 29.90 BBB- 5.12% 0.70 182 15.11 BB A 4.36% 6.19% Data sources: Value Line; H. J. Heinz SEC filings, 200810; case writer estimates; Morningstar