What would be reasonable valuation for this company and why? What advice would you give this company in regards to the declining ratios?
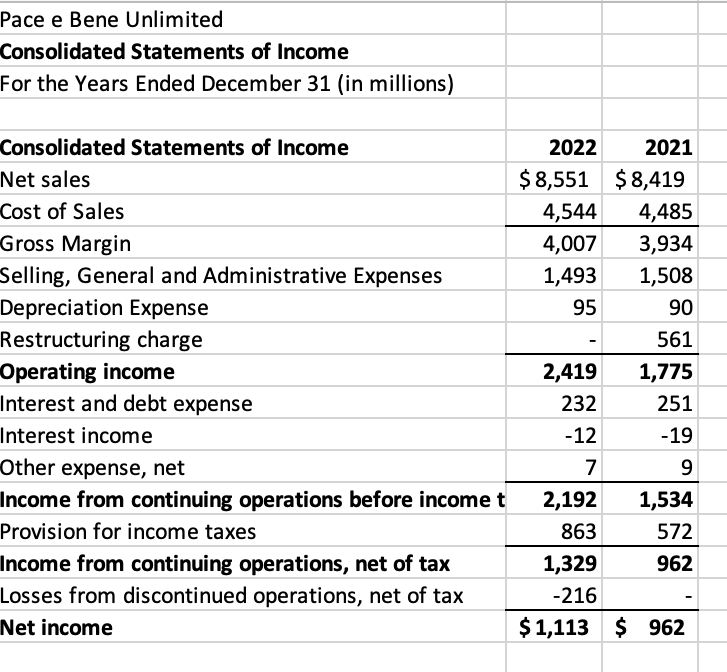
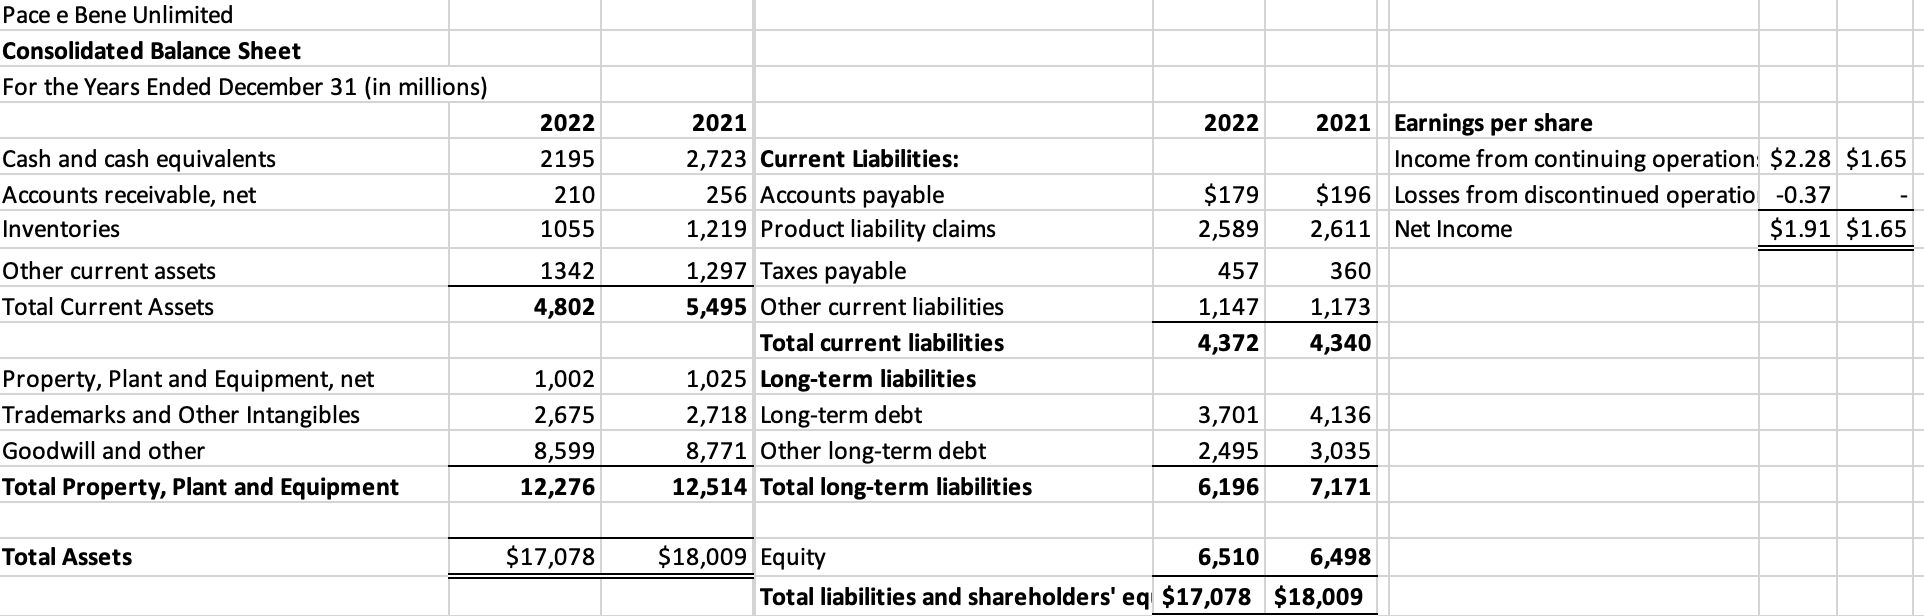
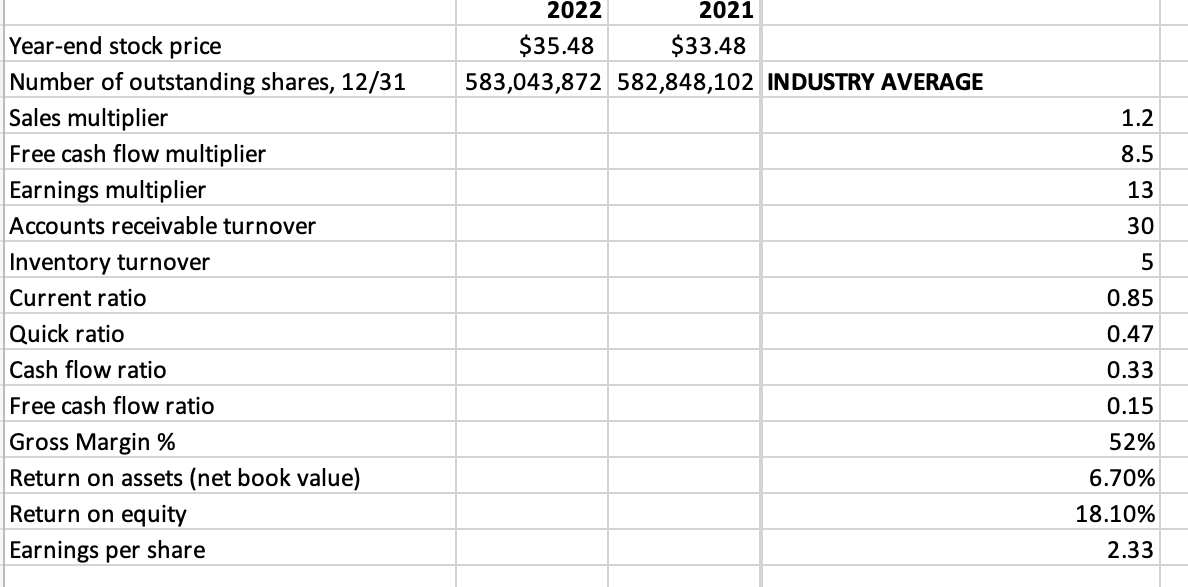
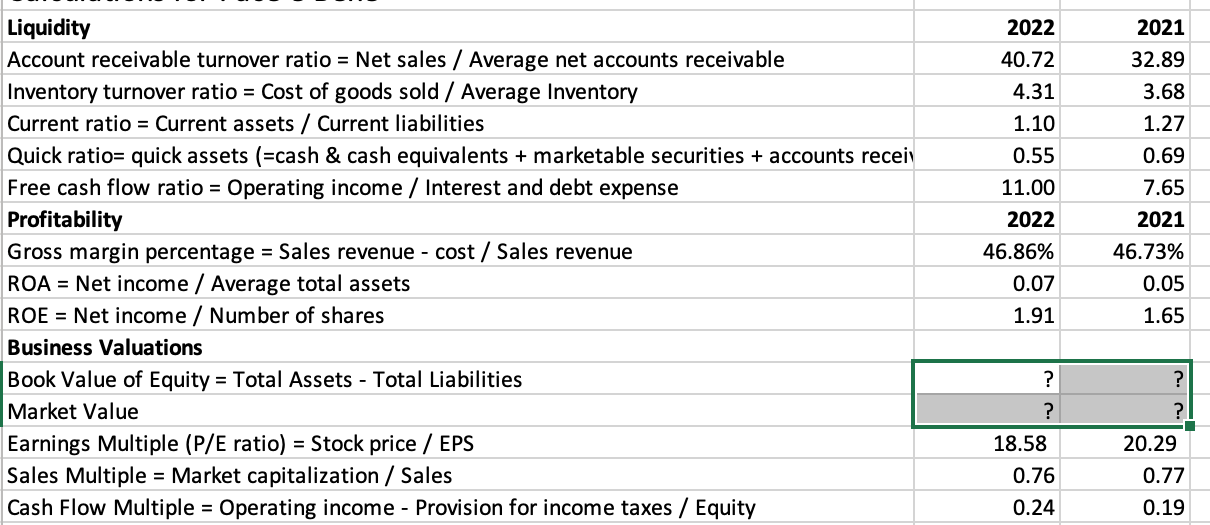
Pace e Bene Unlimited Consolidated Statements of Income For the Years Ended December 31 (in millions) Consolidated Statements of Income Net sales Cost of Sales Gross Margin Selling, General and Administrative Expenses Depreciation Expense Restructuring charge Operating income Interest and debt expense Interest income Other expense, net Income from continuing operations before income t Provision for income taxes Income from continuing operations, net of tax Losses from discontinued operations, net of tax Net income 2022 2021 $ 8,551 $ 8,419 4,544 4,485 4,007 3,934 1,493 1,508 95 90 561 2,419 1,775 232 251 -12 -19 7 9 2,192 1,534 863 572 1,329 962 -216 $ 1,113 $ 962 Pace e Bene Unlimited Consolidated Balance Sheet For the Years Ended December 31 (in millions) 2022 Cash and cash equivalents Accounts receivable, net Inventories 2022 2195 210 1055 2021 Earnings per share Income from continuing operation: $2.28 $1.65 $196 Losses from discontinued operatio -0.37 2,611 Net Income $1.91 $1.65 $179 2,589 1342 457 360 Other current assets Total Current Assets 4,802 2021 2,723 Current Liabilities: 256 Accounts payable 1,219 Product liability claims 1,297 Taxes payable 5,495 Other current liabilities Total current liabilities 1,025 Long-term liabilities 2,718 Long-term debt 8,771 Other long-term debt 12,514 Total long-term liabilities 1,147 4,372 1,173 4,340 Property, plant and Equipment, net Trademarks and Other Intangibles Goodwill and other Total Property, plant and Equipment 1,002 2,675 8,599 12,276 3,701 2,495 6,196 4,136 3,035 7,171 Total Assets $17,078 $18,009 Equity 6,510 6,498 Total liabilities and shareholders' eq $17,078 $18,009 2022 2021 $35.48 $33.48 583,043,872 582,848,102 INDUSTRY AVERAGE 1.2 8.5 13 30 5 Year-end stock price Number of outstanding shares, 12/31 Sales multiplier Free cash flow multiplier Earnings multiplier Accounts receivable turnover Inventory turnover Current ratio Quick ratio Cash flow ratio Free cash flow ratio Gross Margin % Return on assets (net book value) Return on equity Earnings per share 0.85 0.47 0.33 0.15 52% 6.70% 18.10% 2.33 Liquidity Account receivable turnover ratio = Net sales / Average net accounts receivable Inventory turnover ratio = Cost of goods sold / Average Inventory Current ratio = Current assets / Current liabilities Quick ratio= quick assets (=cash & cash equivalents + marketable securities + accounts receiv Free cash flow ratio = Operating income / Interest and debt expense Profitability Gross margin percentage = Sales revenue - cost / Sales revenue ROA = Net income / Average total assets ROE = Net income / Number of shares Business Valuations Book Value of Equity = Total Assets - Total Liabilities Market Value Earnings Multiple (P/E ratio) = Stock price / EPS Sales Multiple = Market capitalization / Sales Cash Flow Multiple = Operating income - Provision for income taxes / Equity 2022 40.72 4.31 1.10 0.55 11.00 2022 46.86% 0.07 1.91 2021 32.89 3.68 1.27 0.69 7.65 2021 46.73% 0.05 1.65 ? ? ? ? 18.58 0.76 0.24 20.29 0.77 0.19 Pace e Bene Unlimited Consolidated Statements of Income For the Years Ended December 31 (in millions) Consolidated Statements of Income Net sales Cost of Sales Gross Margin Selling, General and Administrative Expenses Depreciation Expense Restructuring charge Operating income Interest and debt expense Interest income Other expense, net Income from continuing operations before income t Provision for income taxes Income from continuing operations, net of tax Losses from discontinued operations, net of tax Net income 2022 2021 $ 8,551 $ 8,419 4,544 4,485 4,007 3,934 1,493 1,508 95 90 561 2,419 1,775 232 251 -12 -19 7 9 2,192 1,534 863 572 1,329 962 -216 $ 1,113 $ 962 Pace e Bene Unlimited Consolidated Balance Sheet For the Years Ended December 31 (in millions) 2022 Cash and cash equivalents Accounts receivable, net Inventories 2022 2195 210 1055 2021 Earnings per share Income from continuing operation: $2.28 $1.65 $196 Losses from discontinued operatio -0.37 2,611 Net Income $1.91 $1.65 $179 2,589 1342 457 360 Other current assets Total Current Assets 4,802 2021 2,723 Current Liabilities: 256 Accounts payable 1,219 Product liability claims 1,297 Taxes payable 5,495 Other current liabilities Total current liabilities 1,025 Long-term liabilities 2,718 Long-term debt 8,771 Other long-term debt 12,514 Total long-term liabilities 1,147 4,372 1,173 4,340 Property, plant and Equipment, net Trademarks and Other Intangibles Goodwill and other Total Property, plant and Equipment 1,002 2,675 8,599 12,276 3,701 2,495 6,196 4,136 3,035 7,171 Total Assets $17,078 $18,009 Equity 6,510 6,498 Total liabilities and shareholders' eq $17,078 $18,009 2022 2021 $35.48 $33.48 583,043,872 582,848,102 INDUSTRY AVERAGE 1.2 8.5 13 30 5 Year-end stock price Number of outstanding shares, 12/31 Sales multiplier Free cash flow multiplier Earnings multiplier Accounts receivable turnover Inventory turnover Current ratio Quick ratio Cash flow ratio Free cash flow ratio Gross Margin % Return on assets (net book value) Return on equity Earnings per share 0.85 0.47 0.33 0.15 52% 6.70% 18.10% 2.33 Liquidity Account receivable turnover ratio = Net sales / Average net accounts receivable Inventory turnover ratio = Cost of goods sold / Average Inventory Current ratio = Current assets / Current liabilities Quick ratio= quick assets (=cash & cash equivalents + marketable securities + accounts receiv Free cash flow ratio = Operating income / Interest and debt expense Profitability Gross margin percentage = Sales revenue - cost / Sales revenue ROA = Net income / Average total assets ROE = Net income / Number of shares Business Valuations Book Value of Equity = Total Assets - Total Liabilities Market Value Earnings Multiple (P/E ratio) = Stock price / EPS Sales Multiple = Market capitalization / Sales Cash Flow Multiple = Operating income - Provision for income taxes / Equity 2022 40.72 4.31 1.10 0.55 11.00 2022 46.86% 0.07 1.91 2021 32.89 3.68 1.27 0.69 7.65 2021 46.73% 0.05 1.65 ? ? ? ? 18.58 0.76 0.24 20.29 0.77 0.19