

Question
When analyzing a particular stock's performance (y) compared to the performance of a related benchmark segment of the stock market (x), the slope is a
When analyzing a particular stock's performance (y) compared to the performance of a related benchmark segment of the stock market (x), the slope is a relative risk measurement. The slope depicts a fund's volatility against the benchmark. Many financial analysts calculate the slopes for stock funds using the S&P 500 Index as the benchmark.
This market model assumes that the rate of return of a stock (y) is linearly related to the rate of return (x) of the benchmark:
y = b0 + b1x.
In this context the slope b1 is usually referred to as the beta coefficient of the stock. Beta is explained at most business-oriented web sites, see for example Morningstar.
- Interpretation of beta
- b1 = 1 means the stock's rate of return moves up and down in perfect harmony with the benchmark market.
- b1 > 1 means the stock's rate of return is more sensitive to changes in the level of the benchmark market than is the average stock.
- 0 b1
Investors with a high tolerance for risk like b1 > 1; they can earn more if the overall market improves slightly, but lose more if the market declines even a small amount. Investors with a low tolerance for risk like 0b1
For example, Texaco has a beta coefficient of 0.44, which means that when the overall market rate of return changes by 1%, Texaco's rate of return changes only 0.44%. So Texaco doesn't move much at all relative to the overall market. An investor with a low tolerance for risk would be attracted to Texaco because its beta coefficient is less than 1.
What does r2 mean?
In this setting r2 measures the proportion of the total risk in the particular stock related to the benchmark market and 1 - r2 measures the proportion of the total risk that is related to specific company-related events and decisions.
DO THE FOLLOWING:
Apply the market model to the Standard and Poor's Composite Index (the x-variable) and the monthly returns of Intel (the y-variable) for a recent 4-year period, which are stored in columns 1 and 2, respectively, in this Excel file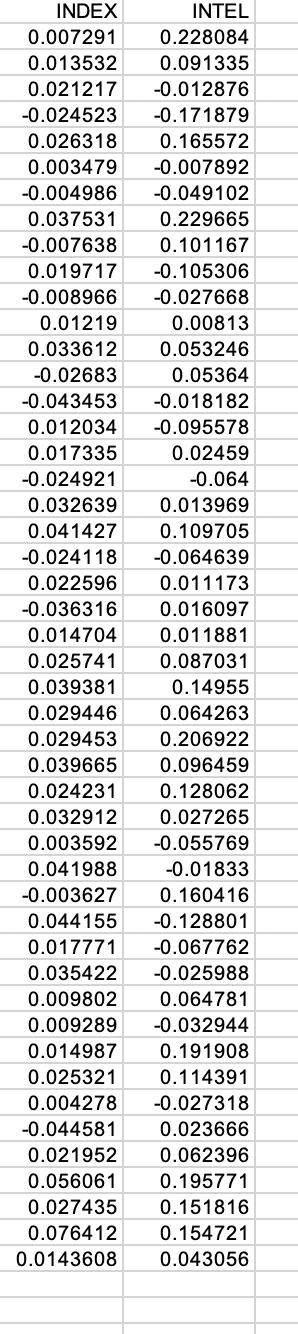
What is the value of the test statistic for the hypothesis test H0: b1 = 0, Ha: b1 0?
What is the P-value for the hypothesis test H0: b1 = 0, Ha: b1 0?
INDEX 0.007291 0.013532 0.021217 -0.024523 0.026318 0.003479 -0.004986 0.037531 -0.007638 0.019717 -0.008966 0.01219 0.033612 -0.02683 -0.043453 0.012034 0.017335 -0.024921 0.032639 0.041427 -0.024118 0.022596 -0.036316 0.014704 0.025741 0.039381 0.029446 0.029453 0.039665 0.024231 0.032912 0.003592 0.041988 -0.003627 0.044155 0.017771 0.035422 0.009802 0.009289 0.014987 0.025321 0.004278 -0.044581 0.021952 0.056061 0.027435 0.076412 0.0143608 INTEL 0.228084 0.091335 -0.012876 -0.171879 0.165572 -0.007892 -0.049102 0.229665 0.101167 -0.105306 -0.027668 0.00813 0.053246 0.05364 -0.018182 -0.095578 0.02459 -0.064 0.013969 0.109705 -0.064639 0.011173 0.016097 0.011881 0.087031 0.14955 0.064263 0.206922 0.096459 0.128062 0.027265 -0.055769 -0.01833 0.160416 -0.128801 -0.067762 -0.025988 0.064781 -0.032944 0.191908 0.114391 -0.027318 0.023666 0.062396 0.195771 0.151816 0.154721 0.043056 INDEX 0.007291 0.013532 0.021217 -0.024523 0.026318 0.003479 -0.004986 0.037531 -0.007638 0.019717 -0.008966 0.01219 0.033612 -0.02683 -0.043453 0.012034 0.017335 -0.024921 0.032639 0.041427 -0.024118 0.022596 -0.036316 0.014704 0.025741 0.039381 0.029446 0.029453 0.039665 0.024231 0.032912 0.003592 0.041988 -0.003627 0.044155 0.017771 0.035422 0.009802 0.009289 0.014987 0.025321 0.004278 -0.044581 0.021952 0.056061 0.027435 0.076412 0.0143608 INTEL 0.228084 0.091335 -0.012876 -0.171879 0.165572 -0.007892 -0.049102 0.229665 0.101167 -0.105306 -0.027668 0.00813 0.053246 0.05364 -0.018182 -0.095578 0.02459 -0.064 0.013969 0.109705 -0.064639 0.011173 0.016097 0.011881 0.087031 0.14955 0.064263 0.206922 0.096459 0.128062 0.027265 -0.055769 -0.01833 0.160416 -0.128801 -0.067762 -0.025988 0.064781 -0.032944 0.191908 0.114391 -0.027318 0.023666 0.062396 0.195771 0.151816 0.154721 0.043056Step by Step Solution
There are 3 Steps involved in it
Step: 1

Get Instant Access to Expert-Tailored Solutions
See step-by-step solutions with expert insights and AI powered tools for academic success
Step: 2

Step: 3
Ace Your Homework with AI
Get the answers you need in no time with our AI-driven, step-by-step assistance
Get Started
Accounting Research In The United States The Euro Zone And Beyond
Authors: Aida Sy
0988919362, 978-0988919365