

Answered step by step
Verified Expert Solution
Question
1 Approved Answer
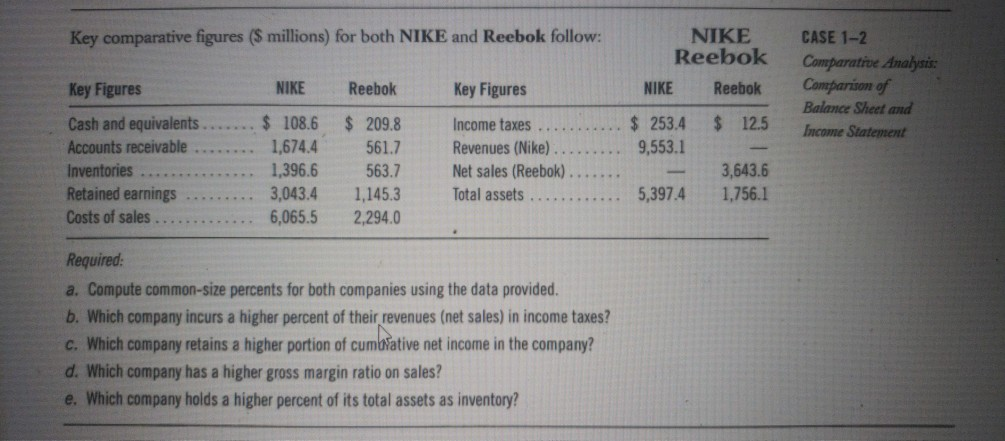
when computing the common size analysis can you also explain where each percentage comes from Key comparative figures ($ millions) for both NIKE and Reebok
when computing the common size analysis can you also explain where each percentage comes from
Key comparative figures ($ millions) for both NIKE and Reebok follow: NIKE Reebok NIKE Reebok Key Figures NIKE Reebok Key Figures CASE 1-2 Comparative Analysis: Comparison of Balance Sheet and Income Statement $ 12.5 $ 253.4 9,553.1 Cash and equivalents Accounts receivable Inventories Retained earnings Costs of sales $ 108.6 1,674.4 1,396.6 3,043.4 6,065.5 $ 209.8 561.7 563.7 1,145.3 2,294.0 Income taxes Revenues (Nike) Net sales (Reebok) Total assets 3,643.6 1,756.1 5,397.4 Required: a. Compute common-size percents for both companies using the data provided. b. Which company incurs a higher percent of their revenues (net sales) in income taxes? c. Which company retains a higher portion of cumbative net income in the company? d. Which company has a higher gross margin ratio on sales? e. Which company holds a higher percent of its total assets as inventoryStep by Step Solution
There are 3 Steps involved in it
Step: 1

Get Instant Access to Expert-Tailored Solutions
See step-by-step solutions with expert insights and AI powered tools for academic success
Step: 2

Step: 3
Ace Your Homework with AI
Get the answers you need in no time with our AI-driven, step-by-step assistance
Get Started
The Organisation Shadow Side Audit
Authors: W Tate
1st Edition
1902433971, 978-1902433974