When Julie Weller joined LLC, the company only produced high-end components in its product line. Much of the assembly was handled by highly-skilled operators, many
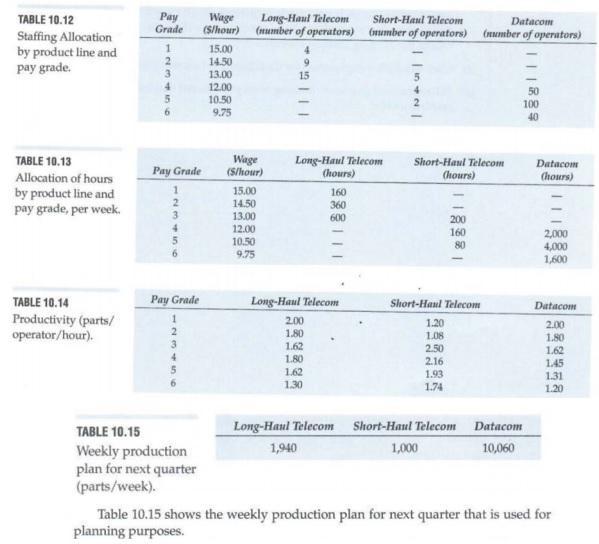
When Julie Weller joined LLC, the company only produced high-end components in its product line. Much of the assembly was handled by highly-skilled operators, many of whom had been with LLC for 7-10 years. On the contrary, their two recent acquisitions had been in less complex products, with more dependence autom.ated assembly techniques and equipment, and less dependence on skilled workers. As a result, LLC's three production lines had different types of workers, with different lev- els of skills, productivity, and wage scales. Table 10.12 summarizes this information. Table 10.13 shows the hourly allocation of the workers across pay grades and product lines given that each operator works an average of 40 hours per week. Given the fluctuation in demand, Julie had felt strongly that operators across all three product lines be cross-trained on each line's processes. That way, if demand for one product line falls, those operators would be able to help out on another line. Af- ter several months, all operators had been cross-trained on all of the processes across the three production lines. Despite the cross-training, Steve Lo (Manufacturing Engineering Manager) no- ticed that there were still productivity differences between the workers, largely re- lated to the experience and skill of the operators at the different pay grades. After reviewing the production records over the past several months, Steve put together the productivity table shown in Table 10.14. While Julie was confident that she could meet this production plan with her cur- rent staffing and allocation, she suspected that she could more efficiently utilize the workers. With the current allocation, there was no room for error-the workers were allocated 100% of their time. There was thus neither time for other projects, nor spare capacity (which often came in handy during end-of-quarter production rushes).
(1) Specify the optimization model for the case above.
(2) The demand of long-haul telecom reported above is just an estimate. In fact, the hourly demand follows Normal (mu=48, sigma=2). Accordingly, the manager requests that the output of long-haul telecom fulfills the varying demands at least 90% of the time. How would you implement the constraint?
(3) Once the constraint of (2) is implemented, we re-solve the optimization problem. We run the model twice and get two different solutions. Can you think of possible reasons for this?
TABLE 10.12 Staffing Allocation by product line and pay grade. TABLE 10.13 Allocation of hours by product line and pay grade, per week. TABLE 10.14 Productivity (parts/ operator/hour). Pay Grade 1 2 3 4 5 6 Pay Grade 1 2 3 4 Pay Grade 123456 TABLE 10.15 Weekly production plan for next quarter (parts/week). Wage (S/hour) 15.00 14.50 13.00 12.00 10.50 9.75 Long-Haul Telecom Short-Haul Telecom Datacom (number of operators) (number of operators) (number of operators) Wage (S/hour) 15.00 14.50 13.00 12.00 10.50 9.75 4951 Long-Haul Telecom (hours) 160 360 600 Long-Haul Telecom 2.00 1.80 1.62 1.80 1.62 1.30 Long-Haul Telecom 1,940 |NG|| Short-Haul Telecom (hours) Short-Haul Telecom 1.20 1.08 2.50 2.16 200 160 80 1.93 1.74 Short-Haul Telecom 1,000 Datacom 10,060 50 100 40 Datacom (hours) 2,000 4,000 1,600 Datacom 2.00 1.80 1.62 1.45 1.31 1.20 Table 10.15 shows the weekly production plan for next quarter that is used for planning purposes.
Step by Step Solution
3.35 Rating (155 Votes )
There are 3 Steps involved in it
Step: 1

See step-by-step solutions with expert insights and AI powered tools for academic success
Step: 2

Step: 3

Ace Your Homework with AI
Get the answers you need in no time with our AI-driven, step-by-step assistance
Get Started


