

Answered step by step
Verified Expert Solution
Question
1 Approved Answer
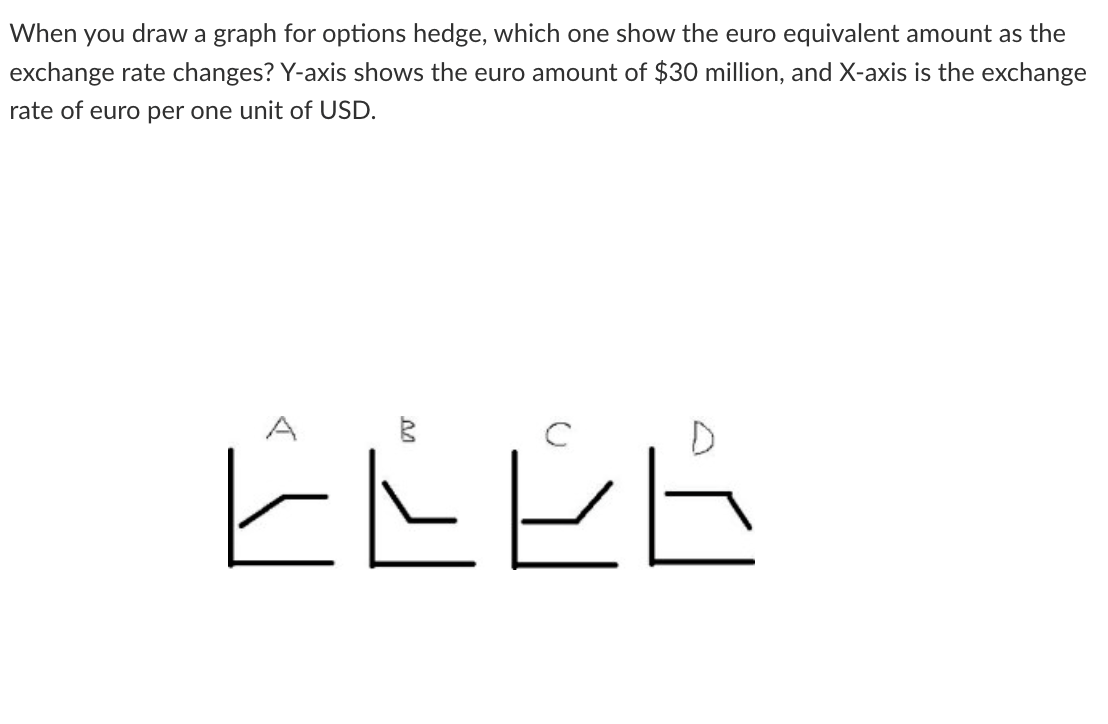
When you draw a graph for options hedge, which one show the euro equivalent amount as the exchange rate changes? Y-axis shows the euro amount
Step by Step Solution
There are 3 Steps involved in it
Step: 1

Get Instant Access to Expert-Tailored Solutions
See step-by-step solutions with expert insights and AI powered tools for academic success
Step: 2

Step: 3
Ace Your Homework with AI
Get the answers you need in no time with our AI-driven, step-by-step assistance
Get Started
Crypto Spotlight Series Binance Coin
Authors: Nott U.r. Keys
1st Edition
979-8853049529