

Question
When you look at the visualization, you notice that some companies have a significant drop from the average gross profit to sales percentage to the
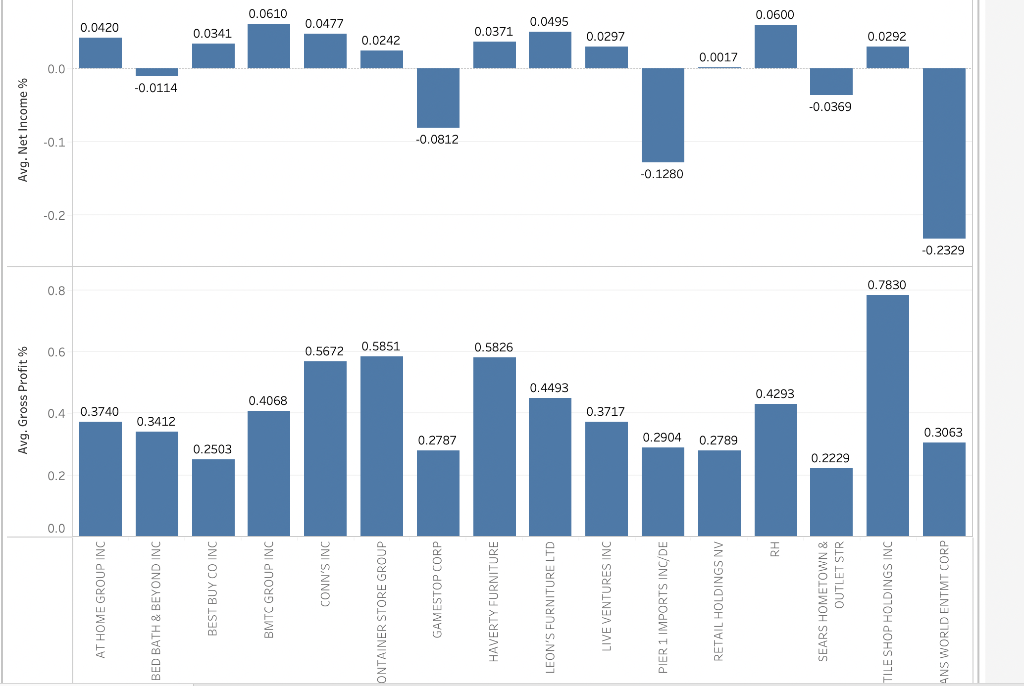 When you look at the visualization, you notice that some companies have a significant drop from the average gross profit to sales percentage to the average net income to sales percentage while others do not though their average gross profit to sales ratios are not too high. How can we explain these differences?
Step by Step Solution
There are 3 Steps involved in it
Step: 1

Get Instant Access to Expert-Tailored Solutions
See step-by-step solutions with expert insights and AI powered tools for academic success
Step: 2

Step: 3
Ace Your Homework with AI
Get the answers you need in no time with our AI-driven, step-by-step assistance
Get Started
Fraud examination
Authors: Steve Albrecht, Chad Albrecht, Conan Albrecht, Mark zimbelma
4th edition
538470844, 978-0538470841