Where can I find the net margin (return on sales) and gross margin from the balance sheet and income statement? 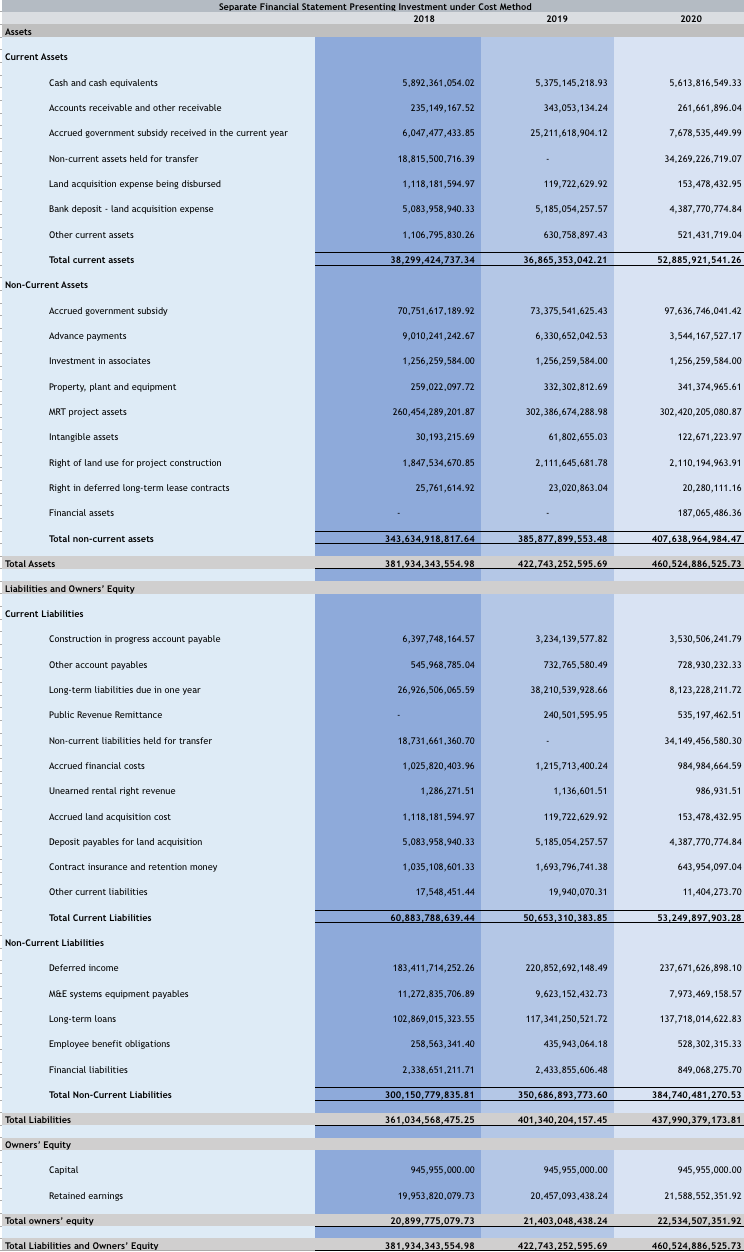
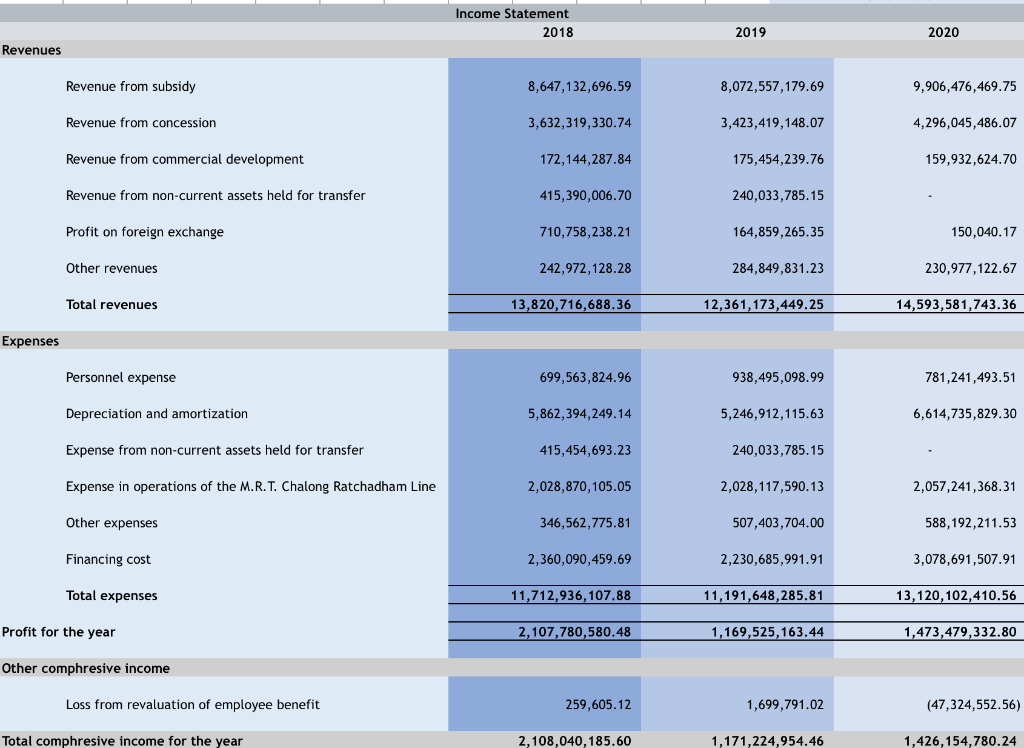
Separate Financial Statement Presenting Investment under Cost Method 2018 2019 2020 Assets Current Assets Cash and cash equivalents 5.892,361,054.02 5.375,145,218.93 5,613,816,549.33 Accounts receivable and other receivable 235,149,167.52 343,053,134.24 261,661,896.04 Accrued government subsidy received in the current year 6,047,477,433.85 25,211,618,904.12 7,678,535,449.99 Non-current assets held for transfer 18.815.500.716.39 34.269.226.719.07 Land acquisition expense being disbursed 1,118,181,594.97 119.722,629.92 153,478,432.95 Bank deposit - land acquisition expense 5,083,958,940.33 5,185,054,257.57 4,387,770,774.84 Other current assets 1,106,795,830.26 630.758.897.43 521,431,719.04 Total current assets 38,299,424,737.34 36,865,353,042.21 52,885,921,541.26 Non-Current Assets Accrued government subsidy 70.751,617,189.92 73,375,541.625.43 97,636.746,041.42 Advance payments 9,010,241,242.67 6,330,652,042.53 3,544,167,527.17 Investment in associates 1,256,259,584.00 1,256,259,584.00 1,256,259,584.00 Property, plant and equipment 259,022,097.72 332,302,812.69 341,374,965.61 MRT project assets 260,454,289,201.87 302,386,674,288.98 302,420,205,080.87 Intangible assets 30,193,215.69 61,802,655.03 122,671,223.97 Right of land use for project construction 1.847,534,670.85 2.111.645,681.78 2.110.194,963.91 Right in deferred long-term lease contracts 25,761,614.92 23,020,863.04 20,280,111.16 Financial assets 187,065,486.36 Total non-current assets 343,634,918,817.64 385,877,899,553.48 407,638,964,984.47 Total Assets 381.934 343,554.98 422,743,252,595.69 460,524,886,525.73 Liabilities and Owners' Equity Current Liabilities Construction in progress account payable 6,397,748,164.57 3,234,139,577.82 3,530,506,241.79 Other account payables 545,968.785.04 732,765,580.49 728.930,232.33 Long-term liabilities due in one year 26,926,506,065.59 38,210,539,928.66 8,123,228,211.72 Public Revenue Remittance 240,501,595.95 535,197,462.51 Non-current liabilities held for transfer 18.731,661,360.70 34.149.456,580.30 Accrued financial costs 1,025,820,403.96 1,215,713,400.24 984,984,664.59 Unearned rental right revenue 1,286,271.51 1,136,601.51 986,931.51 Accrued land acquisition cost 1,118,181,594.97 119.722,629.92 153.478.432.95 Deposit payables for land acquisition 5,083,958,940.33 5.185,054,257.57 4,387.770.774.84 Contract insurance and retention money 1,035,108,601.33 1,693,796,741.38 643,954,097.04 Other current liabilities 17,548,451.44 19,940,070.31 11,404,273.70 Total Current Liabilities 60.883,788,639.44 50,653,310,383.85 53,249,897,903.28 Non-Current Liabilities Deferred income 183,411,714,252.26 220,852,692,148.49 237,671,626,898.10 M&E systems equipment payables 11.272.835,706.89 9,623.152.432.73 7.973.469,158.57 Long-term loans 102,869,015,323.55 117,341,250,521.72 137,718,014,622.83 Employee benefit obligations 258,563, 341.40 435,943,064.18 528,302,315.33 Financial liabilities 2,338,651.211.71 2.433,855,606.48 849,068,275.70 Total Non-Current Liabilities 300,150,779,835.81 350,686,893,773.60 384,740,481,270.53 Total Liabilities 361,034,568,475.25 401,340, 204, 157.45 437,990,379,173.81 Owners' Equity Capital 945,955,000.00 945,955,000.00 945,955,000.00 Retained eamings 19,953,820.079.73 20,457,093,438.24 21,588,552,351.92 Total owners' equity 20,899,775,079.73 21,403,048,438.24 22,534,507,351.92 Total Liabilities and Owners' Equity 381,934,343,554.98 422,743 252.595.69 460,524,886,525.73 Income Statement 2018 2019 2020 Revenues Revenue from subsidy 8,647,132,696.59 8,072,557,179.69 9,906,476,469.75 Revenue from concession 3,632,319,330.74 3,423,419,148.07 4,296,045,486.07 Revenue from commercial development 172, 144,287.84 175,454,239.76 159,932,624.70 Revenue from non-current assets held for transfer 415,390,006.70 240,033,785.15 Profit on foreign exchange 710,758,238.21 164,859,265.35 150,040.17 Other revenues 242,972, 128.28 284,849,831.23 230,977, 122.67 Total revenues 13,820,716,688.36 12,361,173,449.25 14,593,581,743.36 Expenses Personnel expense 699,563,824.96 938,495,098.99 781,241,493.51 Depreciation and amortization 5,862,394,249.14 5,246,912,115.63 6,614,735,829.30 Expense from non-current assets held for transfer 415,454,693.23 240,033,785.15 Expense in operations of the M.R.T. Chalong Ratchadham Line 2,028,870,105.05 2,028,117,590.13 2,057,241,368.31 Other expenses 346,562,775.81 507,403,704.00 588,192,211.53 Financing cost 2,360,090,459.69 2,230,685,991.91 3,078,691,507.91 Total expenses 11,712,936, 107.88 11,191,648,285.81 13,120, 102,410.56 Profit for the year 2,107,780,580.48 1,169,525,163.44 1,473,479,332.80 Other comphresive income Loss from revaluation of employee benefit 259,605.12 1,699,791.02 (47,324,552.56) Total comphresive income for the year 2,108,040,185.60 1,171,224,954.46 1,426,154,780.24