Where:SSR = 4500, R2= 0.43
WeeklyStudyTime= number of minutes students report studying in a week on average
Courses= number of courses students are taking in the semester
AtHome= 0 if students do not live at home, and = 1 if students live at home
Job= 0 if students report not working at a job during the semester, and = 1 if they report working
What is the interpretation ofin this model?
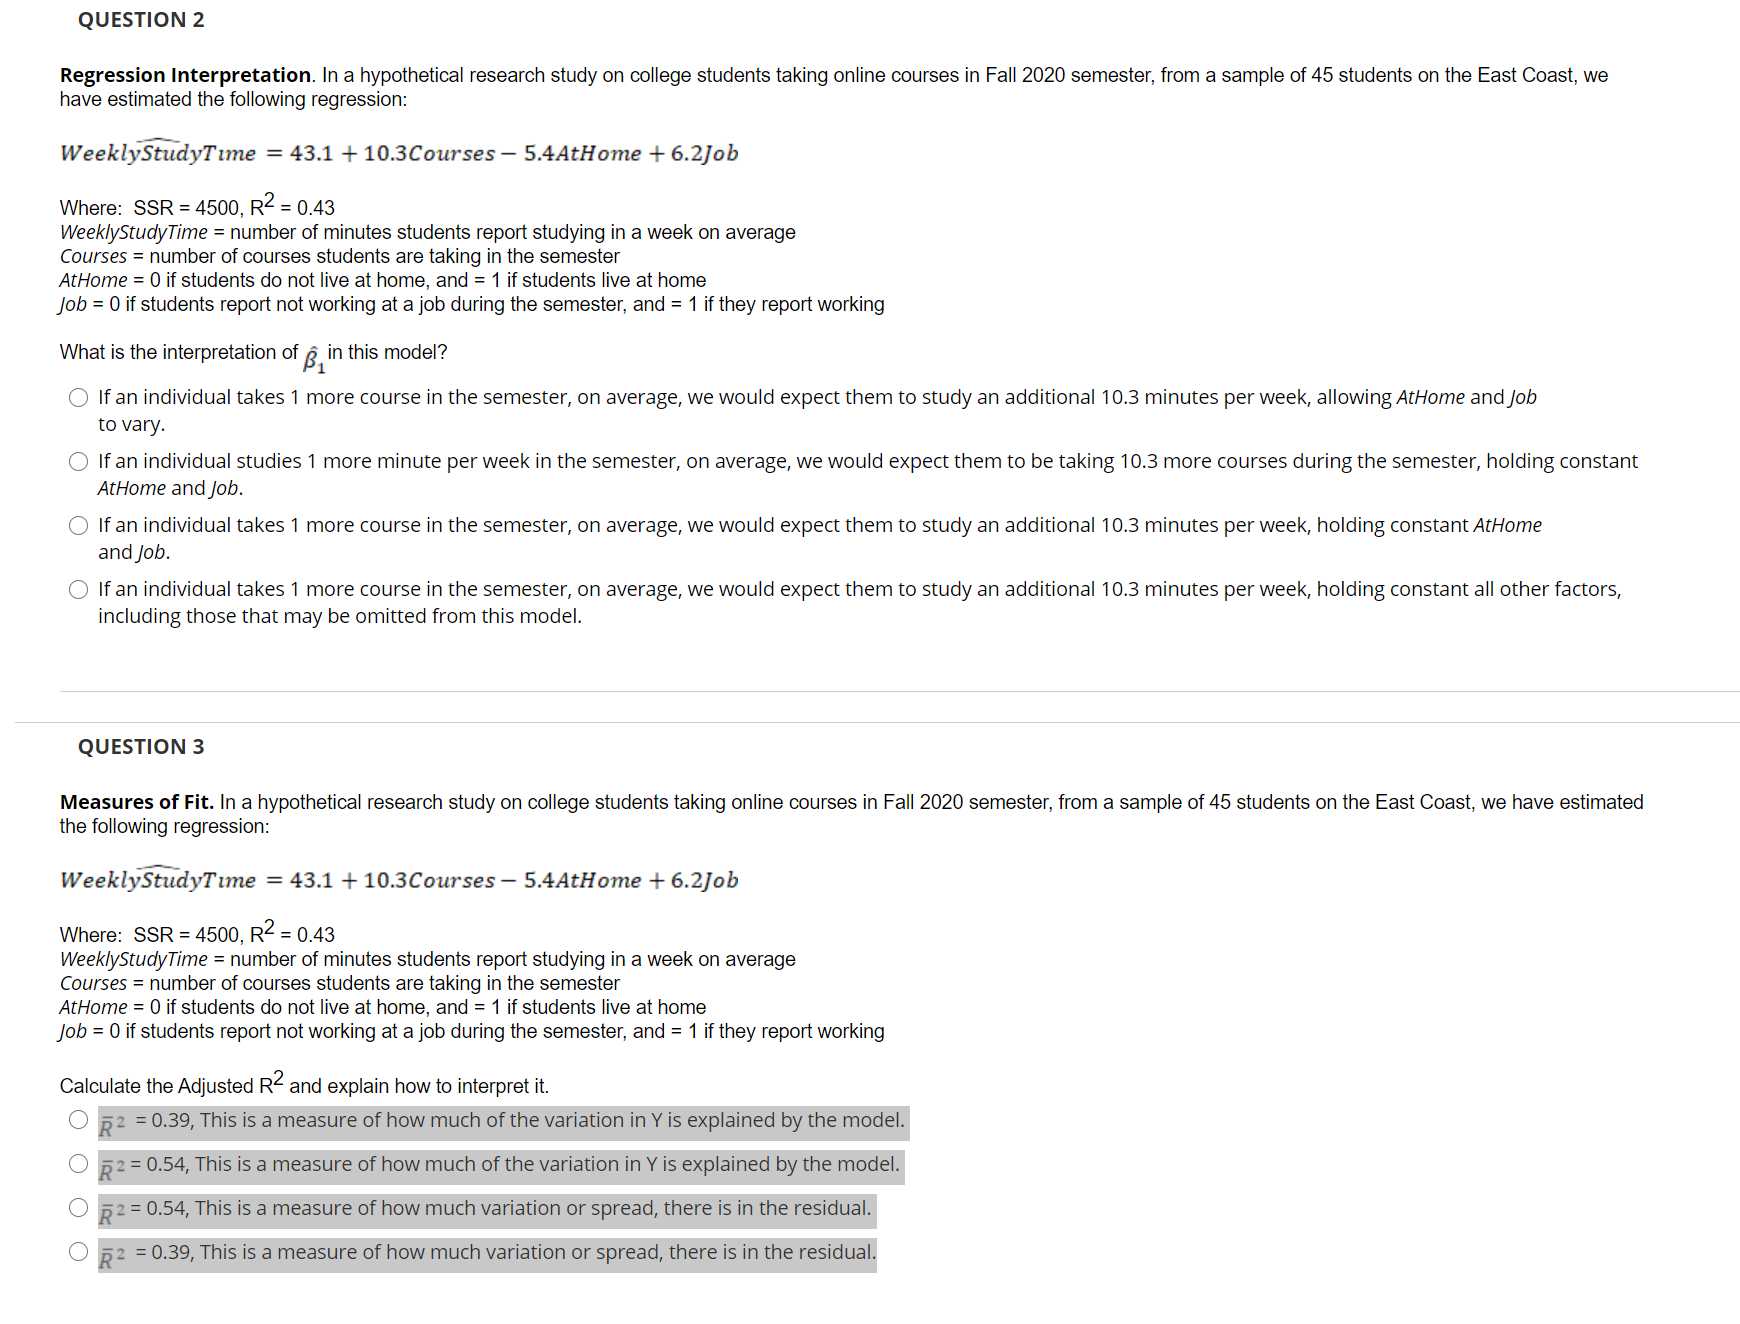
QUESTION 2 Regression Interpretation. In a hypothetical research study on college students taking online courses in Fall 2020 semester, from a sample of 45 students on the East Coast, we have estimated the following regression: WeeklyStudyTime = 43.1 + 10.3Courses - 5.4AtHome + 6.2Job Where: SSR = 4500, R2 = 0.43 WeeklyStudyTime = number of minutes students report studying in a week on average Courses = number of courses students are taking in the semester AtHome = 0 if students do not live at home, and = 1 if students live at home Job = 0 if students report not working at a job during the semester, and = 1 if they report working What is the interpretation of , in this model? If an individual takes 1 more course in the semester, on average, we would expect them to study an additional 10.3 minutes per week, allowing AtHome and Job to vary. O If an individual studies 1 more minute per week in the semester, on average, we would expect them to be taking 10.3 more courses during the semester, holding constant AtHome and Job. If an individual takes 1 more course in the semester, on average, we would expect them to study an additional 10.3 minutes per week, holding constant AtHome and Job. If an individual takes 1 more course in the semester, on average, we would expect them to study an additional 10.3 minutes per week, holding constant all other factors, including those that may be omitted from this model. QUESTION 3 Measures of Fit. In a hypothetical research study on college students taking online courses in Fall 2020 semester, from a sample of 45 students on the East Coast, we have estimated the following regression: WeeklyStudyTime = 43.1 + 10.3Courses - 5.4AtHome + 6.2job Where: SSR = 4500, R2 = 0.43 WeeklyStudyTime = number of minutes students report studying in a week on average Courses = number of courses students are taking in the semester AtHome = 0 if students do not live at home, and = 1 if students live at home Job = 0 if students report not working at a job during the semester, and = 1 if they report working Calculate the Adjusted RZ and explain how to interpret it. OR2 = 0.39, This is a measure of how much of the variation in Y is explained by the model. O 2 = 0.54, This is a measure of how much of the variation in Y is explained by the model. O $ 2 = 0.54, This is a measure of how much variation or spread, there is in the residual. OR2 = 0.39, This is a measure of how much variation or spread, there is in the residual