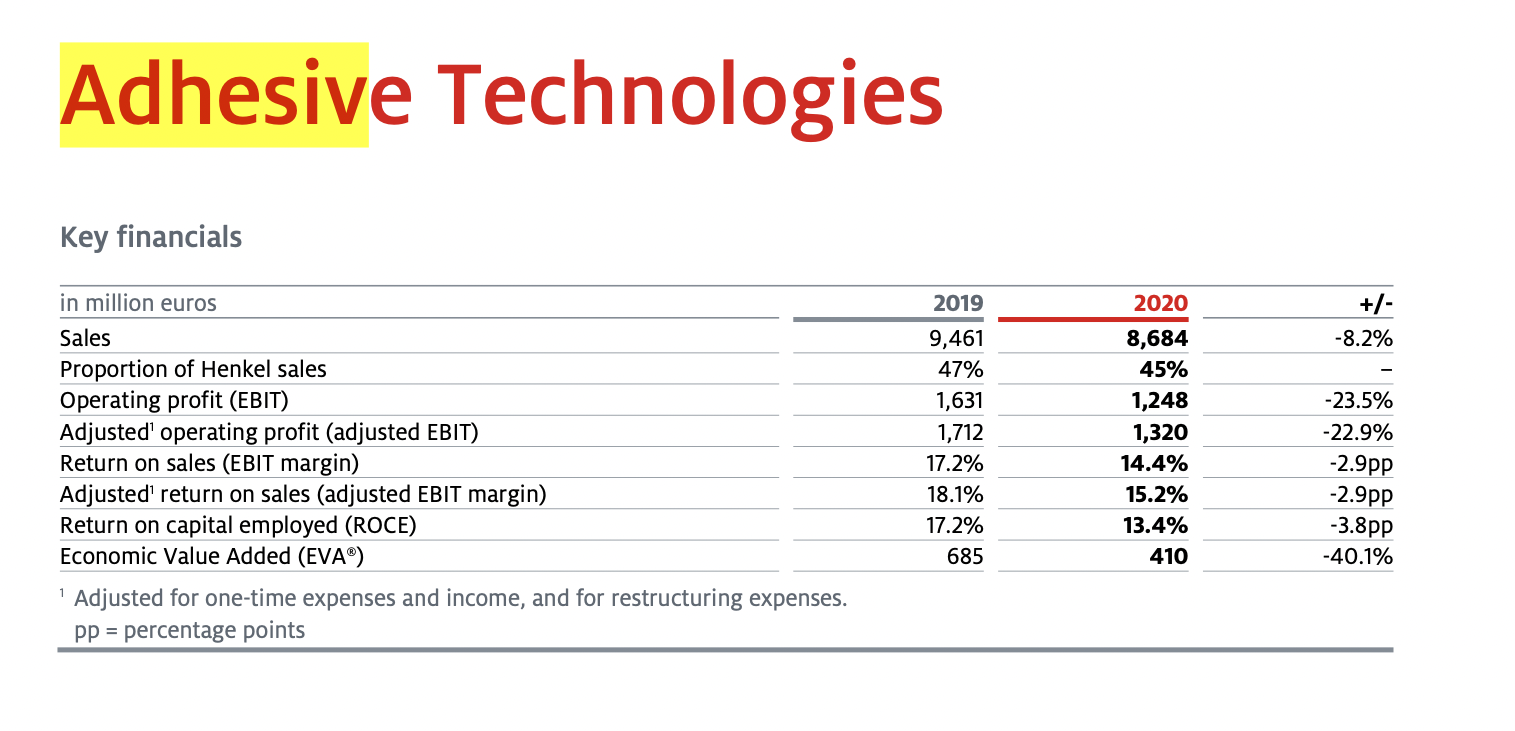
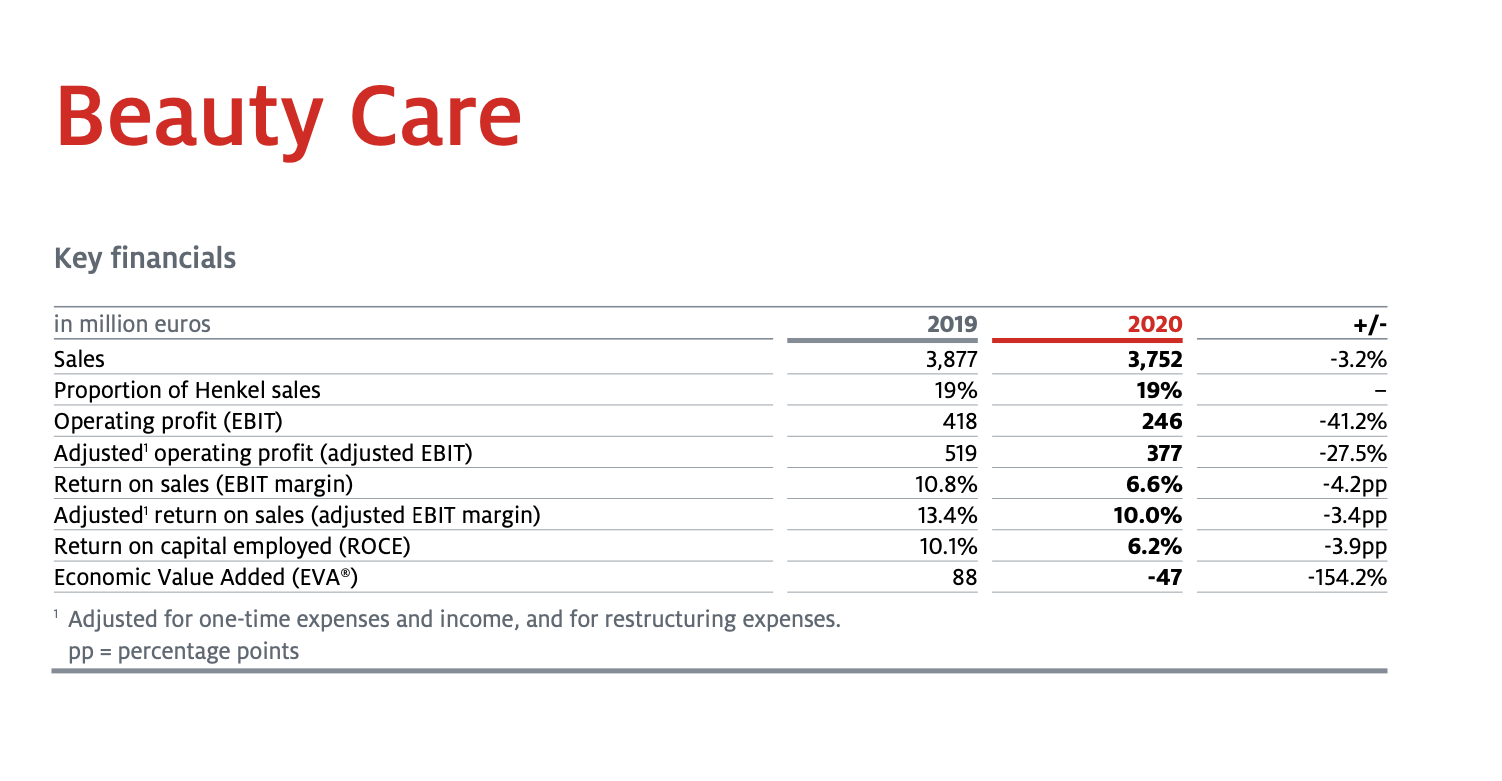
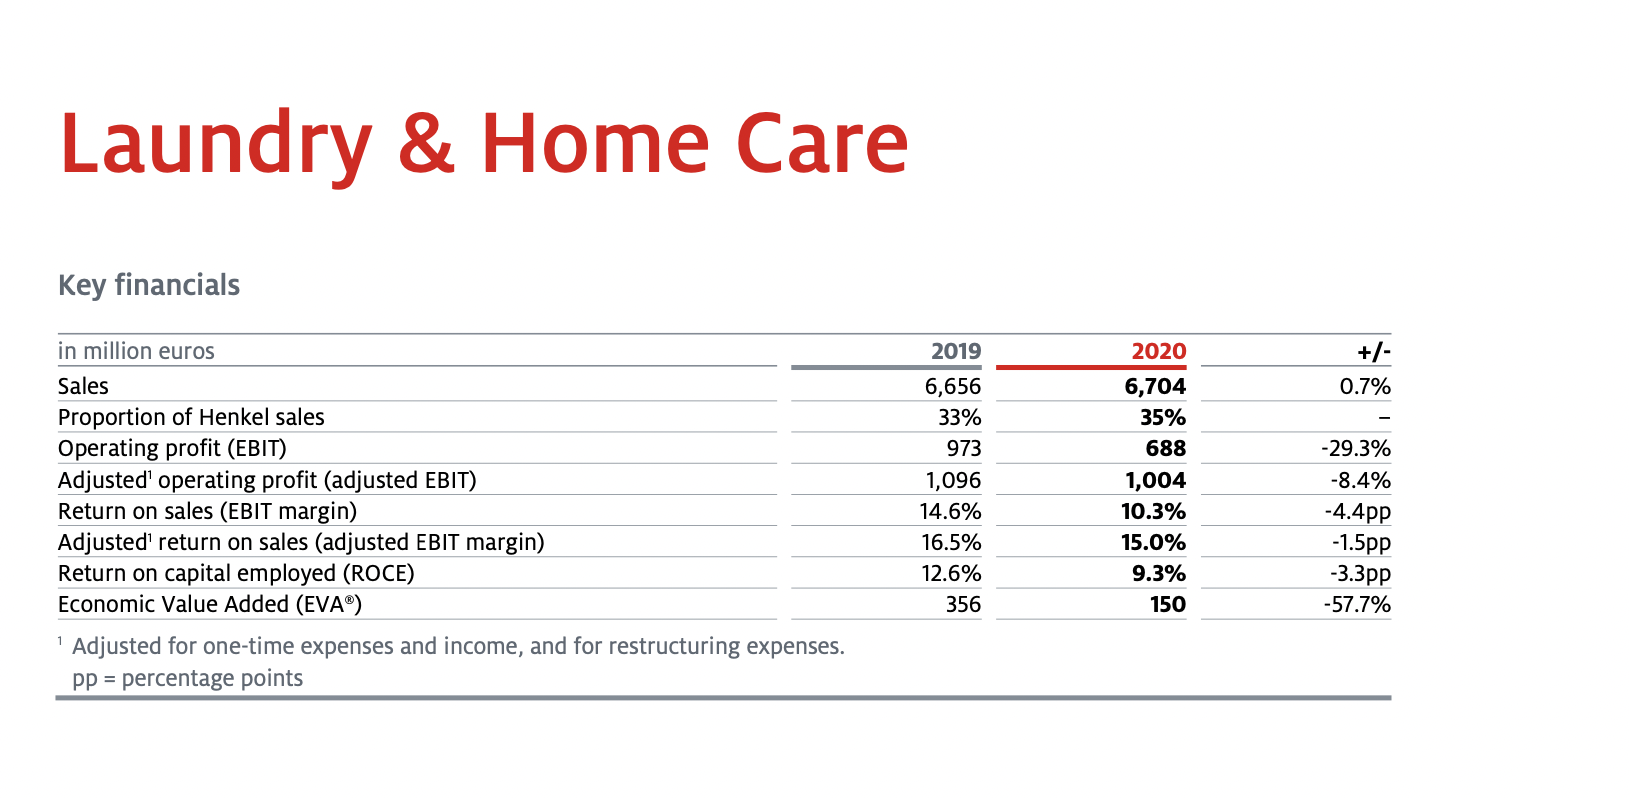
Which business unit has the highest return on invested capital (return on capital employed (ROCE) in 2020?


Adhesive Technologies Key financials 2019 2020 +/- -8.2% in million euros Sales Proportion of Henkel sales Operating profit (EBIT) Adjusted' operating profit (adjusted EBIT) Return on sales (EBIT margin) Adjusted' return on sales (adjusted EBIT margin) Return on capital employed (ROCE) Economic Value Added (EVA) Adjusted for one-time expenses and income, and for restructuring expenses. pp = percentage points 9,461 47% 1,631 1,712 17.2% 18.1% 17.2% 685 8,684 45% 1,248 1,320 14.4% 15.2% 13.4% 410 -23.5% -22.9% -2.9pp -2.9pp -3.8pp -40.1% 1 Beauty Care Key financials 2019 +/- -3.2% in million euros Sales Proportion of Henkel sales Operating profit (EBIT) Adjusted' operating profit (adjusted EBIT) Return on sales (EBIT margin) Adjusted' return on sales (adjusted EBIT margin) Return on capital employed (ROCE) Economic Value Added (EVA) Adjusted for one-time expenses and income, and for restructuring expenses. pp = percentage points 3,877 19% 418 519 10.8% 13.4% 10.1% 88 2020 3,752 19% 246 377 6.6% 10.0% 6.2% -47 -41.2% -27.5% -4.2pp -3.4pp -3.9pp -154.2% Laundry & Home Care Key financials 2019 2020 +/- 0.7% in million euros Sales Proportion of Henkel sales Operating profit (EBIT) Adjusted' operating profit (adjusted EBIT) Return on sales (EBIT margin) Adjusted' return on sales (adjusted EBIT margin) Return on capital employed (ROCE) Economic Value Added (EVA) Adjusted for one-time expenses and income, and for restructuring expenses. pp = percentage points 6,656 33% 973 1,096 14.6% 16.5% 12.6% 356 6,704 35% 688 1,004 10.3% 15.0% 9.3% 150 -29.3% -8.4% -4.4pp -1.5pp -3.3pp -57.7% Adhesive Technologies Key financials 2019 2020 +/- -8.2% in million euros Sales Proportion of Henkel sales Operating profit (EBIT) Adjusted' operating profit (adjusted EBIT) Return on sales (EBIT margin) Adjusted' return on sales (adjusted EBIT margin) Return on capital employed (ROCE) Economic Value Added (EVA) Adjusted for one-time expenses and income, and for restructuring expenses. pp = percentage points 9,461 47% 1,631 1,712 17.2% 18.1% 17.2% 685 8,684 45% 1,248 1,320 14.4% 15.2% 13.4% 410 -23.5% -22.9% -2.9pp -2.9pp -3.8pp -40.1% 1 Beauty Care Key financials 2019 +/- -3.2% in million euros Sales Proportion of Henkel sales Operating profit (EBIT) Adjusted' operating profit (adjusted EBIT) Return on sales (EBIT margin) Adjusted' return on sales (adjusted EBIT margin) Return on capital employed (ROCE) Economic Value Added (EVA) Adjusted for one-time expenses and income, and for restructuring expenses. pp = percentage points 3,877 19% 418 519 10.8% 13.4% 10.1% 88 2020 3,752 19% 246 377 6.6% 10.0% 6.2% -47 -41.2% -27.5% -4.2pp -3.4pp -3.9pp -154.2% Laundry & Home Care Key financials 2019 2020 +/- 0.7% in million euros Sales Proportion of Henkel sales Operating profit (EBIT) Adjusted' operating profit (adjusted EBIT) Return on sales (EBIT margin) Adjusted' return on sales (adjusted EBIT margin) Return on capital employed (ROCE) Economic Value Added (EVA) Adjusted for one-time expenses and income, and for restructuring expenses. pp = percentage points 6,656 33% 973 1,096 14.6% 16.5% 12.6% 356 6,704 35% 688 1,004 10.3% 15.0% 9.3% 150 -29.3% -8.4% -4.4pp -1.5pp -3.3pp -57.7%


