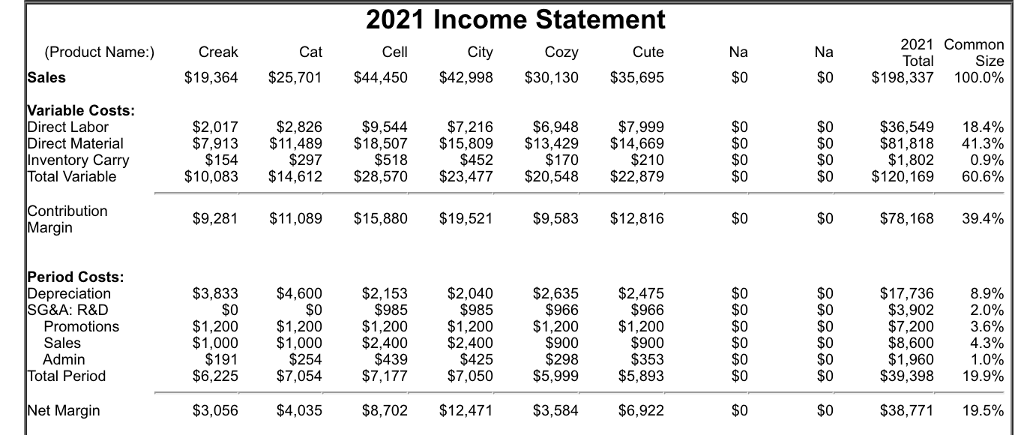
| Which company has the least efficient SG&A/Sales ratio? | Select: 1 | | | Andrews | | | Baldwin | | | Chester | | | Digby | | | Income Statement Survey | Andrews | Baldwin | Chester | Digby | | Sales | $141,081 | $156,645 | $198,337 | $268,704 | | Variable Costs (Labor, Material, Carry) | $70,026 | $90,540 | $120,169 | $153,664 | | Depreciation | $9,932 | $15,967 | $17,736 | $10,277 | | SGA (R&D, Promo, Sales, Admin) | $14,065 | $15,647 | $21,662 | $14,385 | | Other (Fees, Writeoffs, TQM, Bonuses) | $2,176 | $4,733 | $5,200 | $6,093 | | EBIT | $44,882 | $29,758 | $33,571 | $84,285 | | Interest (Short term, Long term) | $82 | $13,904 | $15,757 | $6,954 | | Taxes | $15,680 | $5,549 | $6,235 | $27,066 | | Profit Sharing | $582 | $206 | $232 | $1,005 | | Net Profit | $28,537 | $10,099 | $11,347 | $49,260 | | 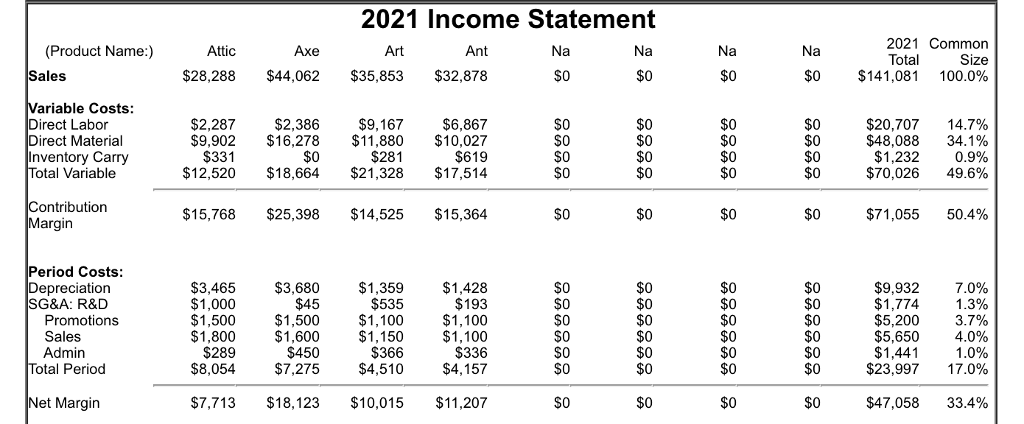

|
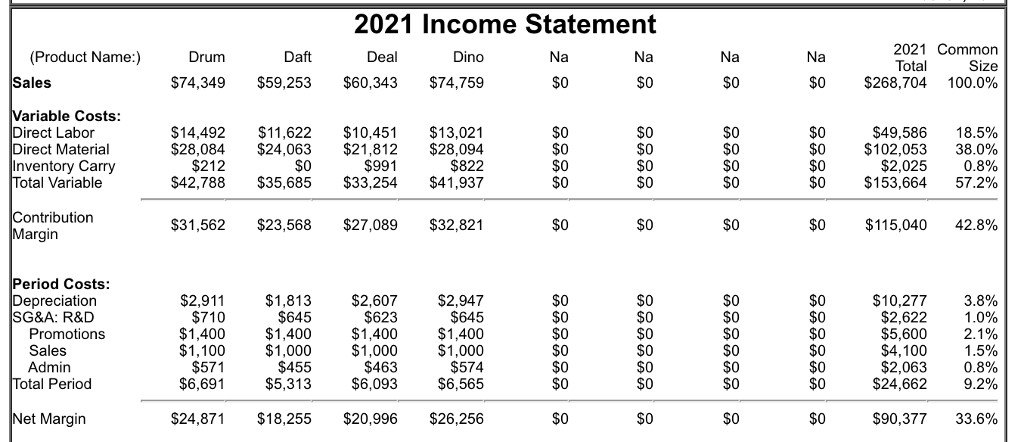 |
2021 Income Statement (Product Name:) Sales 2021 Common Size $141,081 100.0% Attic Axe Ant Total $28,288 $44,062 $35,853 $32,878 $0 $0 $0 ariable Costs Direct Labor Direct Material Inventory Carry Total Variable $9,167 $6,867 $9,902$16,278 $11,880 $10,027 $619 $12,520 $18,664 $21,328 $17,51.4 $2,287 $2,386 $0 $0 $0 $0 $20,707 $48,088 $1,232 $70,026 14.7% 34.1% 0.9% 49.6% $331 $281 $0 $0 $0 $0 Contribution Margin $15,768 $25,398 $14,525 $15,364 $0 $0 $0 $0 $71,055 50.4% Period Costs $3,465 $3,680 $1,359 $1,428 $193 $1,100 $1,100 $336 $8,054$7,275$4,510 $4,157 $9,932 $1,774 $5,200 $5,650 $1,441 $23,997 7.0% 1.3% 3.7% 4.0% 1.0% 17.0% Depreciation SG&A: R&D $1,000 $1,500 $1,800 $289 $45 $1,500 $1,600 $450 $535 $1,100 $1,150 $366 $0 $0 $0 $0 $0 $0 $0 $0 $0 Promotions Sales Admin Total Period $0 $0 $0 Net Margirn $7,713$18,123 $10,015 $11,207 $47,058 33.4% 2021 Income Statement 2021 Common Size $156,645 100.0% Best Beetle (Product Name:) Sales Bam Bit Total $28,485 $28,835 $48,339 $50,986 $0 $0 ariable Costs: Direct Labor $9,579$8,812 $12,597 $13,179 $19,067 $19,785 $416 $15,766 $16,773 $28,988$29,013 $2,961 $3,348 $24,701 $64,628 $1,211 $90,540 15.8% 41.3% 0.8% 57.8% irect Material $0 $0 $0 $0 SO $0 $208 $246 $342 $0 Inventory Carry Total Variable ontribution Margin $12,719 $12,062 $19,351 $21,974 $0 $0 $0 $0 $66,105 42.2% Period Costs: Depreciation SG&A: R&D $4,447 $446 $2,913 $966 $3,547 $966 $1,300 $1,300 $1,300 $1,300 $1,400 $528 $8,088 $8,705 $7,080 $7,741 $5,060 $446 $15,967 $2,824 $5,200 $6,000 $1,623 $31,614 10.2% 1.8% 3.3% 3.8% 1.0% 20.2% $0 $0 $0 $0 SO $0 Promotions $0 Sales Admin otal Period $1,600 $295 $1,600 $299 $1,400 $501 $0 $0 $0 $0 SO $0 $0 Net Margin $4,631 $3,357$12,270 $14,233 $0 $0 $0 S0 $34.492 22.0% 2021 Income Statement Cute $19,364 $25,701 $44,450 $42,998 $30,130 $35,695 2021 Common Size $198,337 100.0% Cell (Product Name Crealk Sales Cat Cozy Total $0 $0 ariable Costs Direct Labor Direct Material Inventory Carry Total Variable $2,017 $2,826 $9,544$7,216 $6,948 $7,999 $7,913 $11,489 $18,507 $15,809 $13,429 $14,669 $210 $10,083 $14,612 $28,570 $23,477 $20,548 $22,879 $0 $0 $0 $0 $0 $0 $36,549 $81,818 $1,802 $120,169 18.4% 41.3% 0.9% 60.6% $154 $297 $518 $452 $170 Contribution Margin $9,281 $11,089 $15,880$19,521$9,583 $12,816 $78,168 39.4% Period Costs Depreciation SG&A: R&D $3,833 $4,600 $2,153 $2,040 $2,635 $2,475 $966 $1,200 $1,200 $1,200 $1,200 $1,200$1,200 $900 $353 $6,225 $7,054$7,177 $7,050 $5,999 $5,893 $0 $0 $0 $0 $0 $0 $17,736 $3,902 $7,200 $8,600 $1,960 $39,398 8.9% 2.0% 3.6% 4.3% 1.0% 19.9% $985 $985 $966 Promotions Sales Admin Total Period $1,000 $1,000 $2,400 $2,400 $425 $900 $298 $191 $254 $439 $0 $0 Net Margin $3,056 $4,035 $8,702 $12,471 $3,584$6,922 $0 $0 $38,771 19.5% 2021 Income Statement (Product Name) Drum Sales 2021 Common Size $0 $268,704 100.0% Daft Deal Dino Total $74,349 $59,253 $60,343 $74,759 S0 $0 S0 ariable Costs: Direct Labor Direct Material Inventory Carry $14,492 $11,622 $10,451 $13,021 $28,084 $24,063 $21,812 $28,09.4 $822 $42,788 $35,685 $33,254 $41,937 S0 $0 $0 S0 $0 $0 S0 $0 $0 S0 $0 $0 $0 $0 $49,586 $102,053 $2,025 $153,664 18.5% 38.0% 0.8% 57.2% $212 $991 otal Variable $0 Contribution Margin $31,562 $23,568 $27,089$32,821 $0 $115,040 42.8% Period Costs $2,947 $645 $1,400 $1,400 $1,400 $1,400 $1,000 $574 $5,313 $6,093 $6,565 $2,911 $710 $1,813 $645 $2,607 $623 S0 $0 $0 $0 S0 $0 $0 $0 $10,277 $2,622 $5,600 $4,100 $2,063 $24,662 Depreciation SG&A: R&D 3.8% 1.0% 2.1% 1.5% 0.8% 9.2% Promotions Sales Admin Total Period $1,100 $571 $6,691 $1,000 $455 $1,000 $463 S0 $0 $0 $0 S0 $0 SO $0 Net Margin $24,871 $18,255 $20,996$26,256 S0 $0 S0 $90,377 33.6%