

Answered step by step
Verified Expert Solution
Question
1 Approved Answer
which data? 4. Use the Pivot Table report to analyze the sales by department. Change the number format of the sales data to currency and
which data?
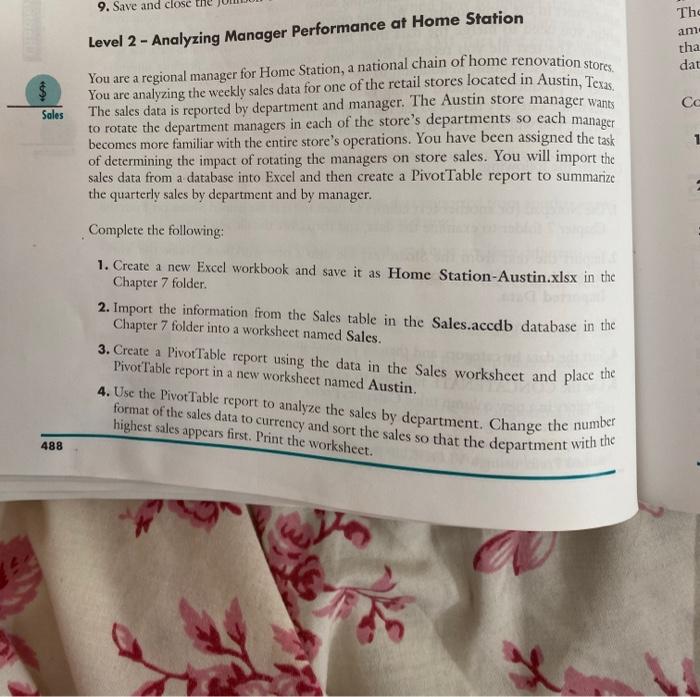
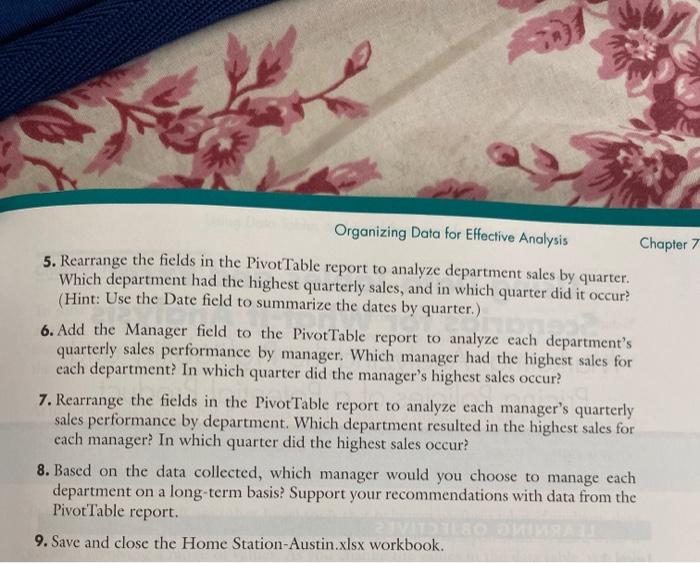
4. Use the Pivot Table report to analyze the sales by department. Change the number format of the sales data to currency and sort the sales so that the department with the 9. Save and close the Thc an tha Level 2 - Analyzing Manager Performance at Home Station dat $ Sales You are a regional manager for Home Station, a national chain of home renovation stores You are analyzing the weekly sales data for one of the retail stores located in Austin, Texas The sales data is reported by department and manager. The Austin store manager wants to rotate the department managers in each of the store's departments so each manager becomes more familiar with the entire store's operations. You have been assigned the task of determining the impact of rotating the managers on store sales. You will import the sales data from a database into Excel and then create a Pivot Table report to summarize the quarterly sales by department and by manager. 1 Complete the following: 1. Create a new Excel workbook and save it as Home Station-Austin.xlsx in the Chapter 7 folder. 2. Import the information from the Sales table in the Sales.accdb database in the Chapter 7 folder into a worksheet named Sales. 3. Create a Pivot Table report using the data in the Sales worksheet and place the Pivot Table report in a new worksheet named Austin. highest sales appears first. Print the worksheet. 488 Organizing Data for Effective Analysis Chapter 7 5. Rearrange the fields in the Pivot Table report to analyze department sales by quarter. Which department had the highest quarterly sales, and in which quarter did it occur? (Hint: Use the Date field to summarize the dates by quarter.) 6. Add the Manager field to the Pivot Table report to analyze each department's quarterly sales performance by manager. Which manager had the highest sales for each department? In which quarter did the manager's highest sales occur? 7. Rearrange the fields in the Pivot Table report to analyze each manager's quarterly sales performance by department. Which department resulted in the highest sales for cach manager? In which quarter did the highest sales occur? 8. Based on the data collected, which manager would you choose to manage each department on a long-term basis? Support your recommendations with data from the Pivot Table report. 9. Save and close the Home Station-Austin.xlsx workbook. 4. Use the Pivot Table report to analyze the sales by department. Change the number format of the sales data to currency and sort the sales so that the department with the 9. Save and close the Thc an tha Level 2 - Analyzing Manager Performance at Home Station dat $ Sales You are a regional manager for Home Station, a national chain of home renovation stores You are analyzing the weekly sales data for one of the retail stores located in Austin, Texas The sales data is reported by department and manager. The Austin store manager wants to rotate the department managers in each of the store's departments so each manager becomes more familiar with the entire store's operations. You have been assigned the task of determining the impact of rotating the managers on store sales. You will import the sales data from a database into Excel and then create a Pivot Table report to summarize the quarterly sales by department and by manager. 1 Complete the following: 1. Create a new Excel workbook and save it as Home Station-Austin.xlsx in the Chapter 7 folder. 2. Import the information from the Sales table in the Sales.accdb database in the Chapter 7 folder into a worksheet named Sales. 3. Create a Pivot Table report using the data in the Sales worksheet and place the Pivot Table report in a new worksheet named Austin. highest sales appears first. Print the worksheet. 488 Organizing Data for Effective Analysis Chapter 7 5. Rearrange the fields in the Pivot Table report to analyze department sales by quarter. Which department had the highest quarterly sales, and in which quarter did it occur? (Hint: Use the Date field to summarize the dates by quarter.) 6. Add the Manager field to the Pivot Table report to analyze each department's quarterly sales performance by manager. Which manager had the highest sales for each department? In which quarter did the manager's highest sales occur? 7. Rearrange the fields in the Pivot Table report to analyze each manager's quarterly sales performance by department. Which department resulted in the highest sales for cach manager? In which quarter did the highest sales occur? 8. Based on the data collected, which manager would you choose to manage each department on a long-term basis? Support your recommendations with data from the Pivot Table report. 9. Save and close the Home Station-Austin.xlsx workbook Step by Step Solution
There are 3 Steps involved in it
Step: 1

Get Instant Access to Expert-Tailored Solutions
See step-by-step solutions with expert insights and AI powered tools for academic success
Step: 2

Step: 3
Ace Your Homework with AI
Get the answers you need in no time with our AI-driven, step-by-step assistance
Get Started
Concepts of Database Management
Authors: Philip J. Pratt, Joseph J. Adamski
7th edition
978-1111825911, 1111825912, 978-1133684374, 1133684378, 978-111182591