
 Which expenses are responsible of the difference between the planned and actual profit and why the expense is higher than expected? (Find the static budget variances)
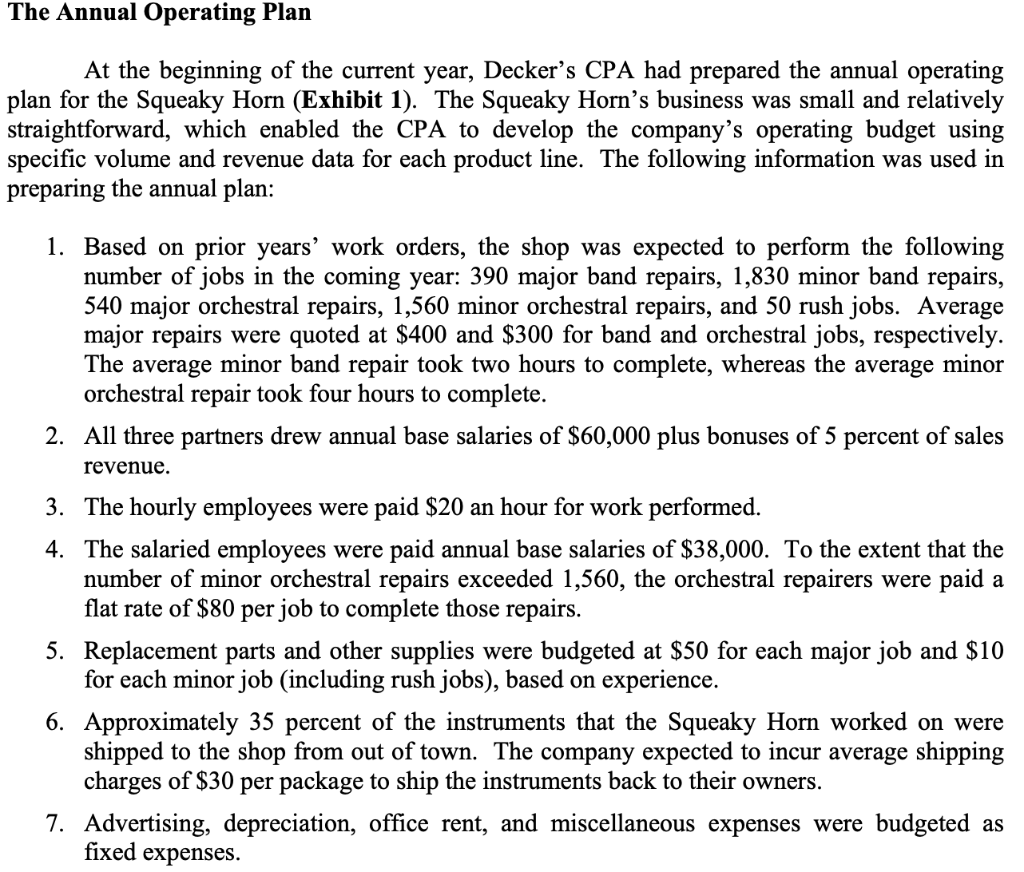
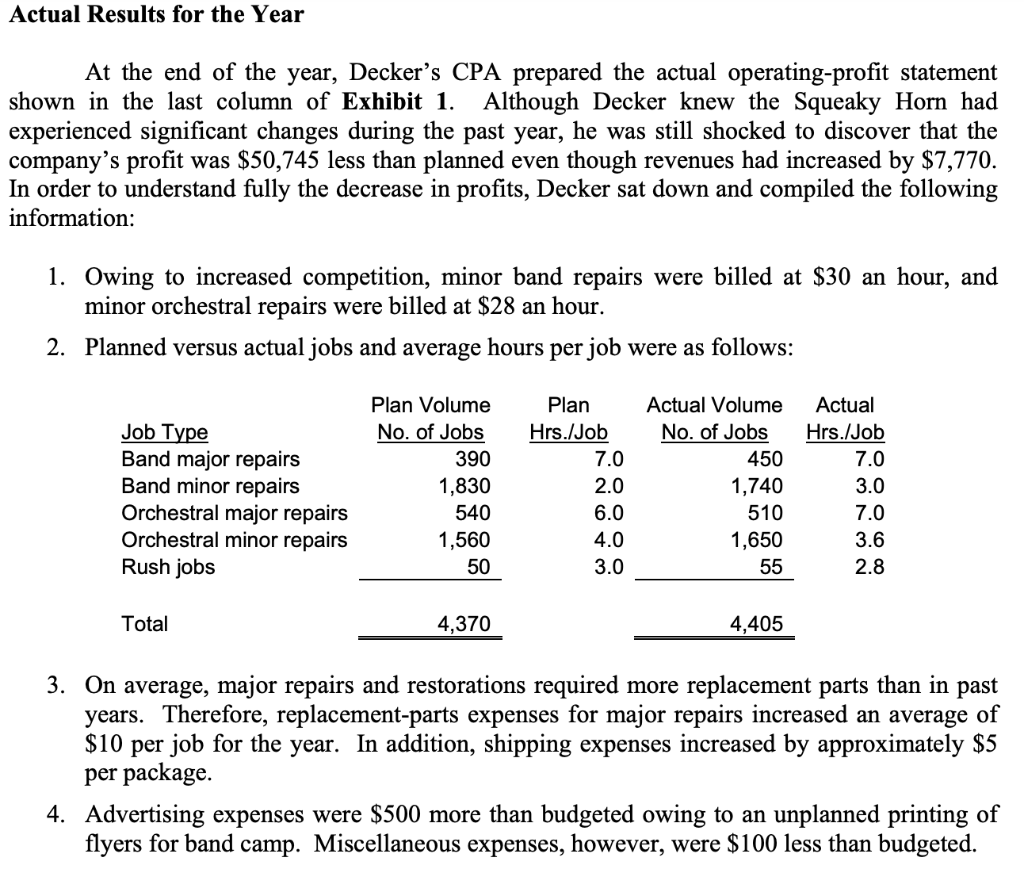
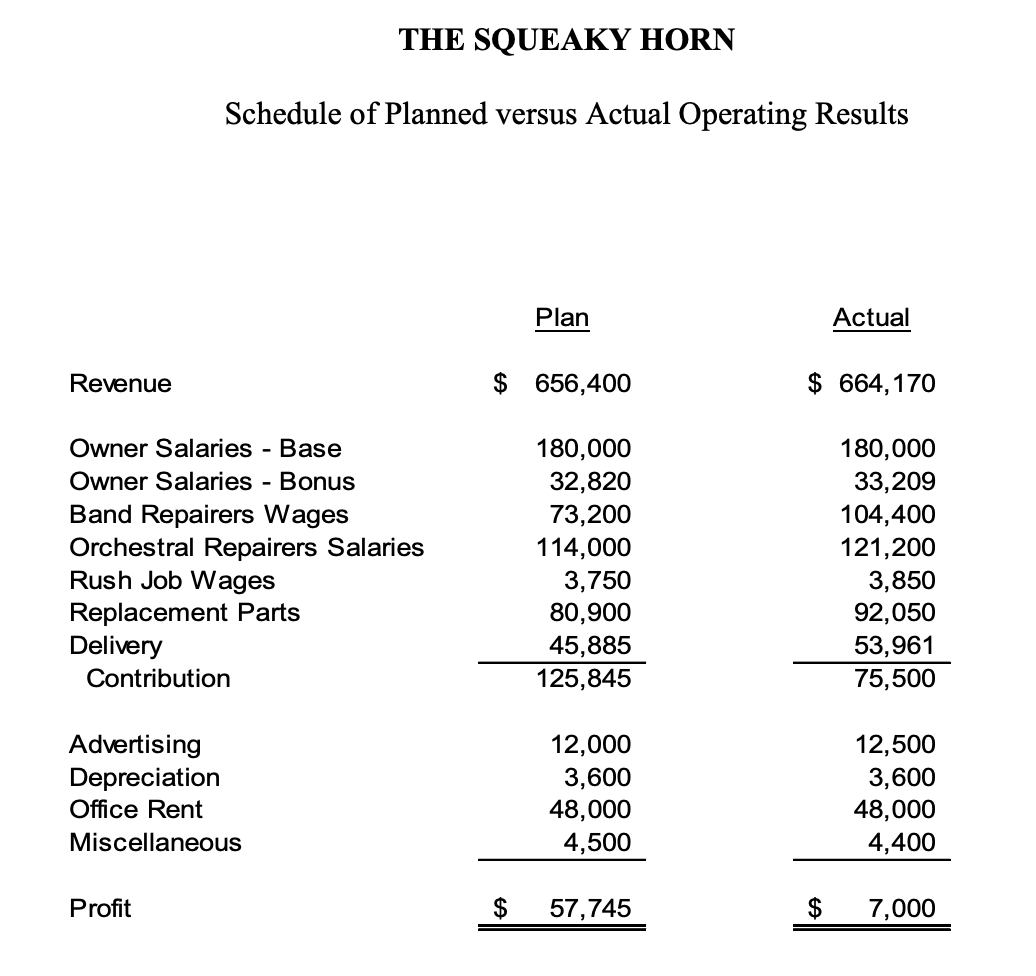
The Annual Operating Plan At the beginning of the current year, Decker's CPA had prepared the annual operating plan for the Squeaky Horn (Exhibit 1). The Squeaky Horn's business was small and relatively straightforward, which enabled the CPA to develop the company's operating budget using specific volume and revenue data for each product line. The following information was used in preparing the annual plan: 1. Based on prior years' work orders, the shop was expected to perform the following number of jobs in the coming year: 390 major band repairs, 1,830 minor band repairs, 540 major orchestral repairs, 1,560 minor orchestral repairs, and 50 rush jobs. Average major repairs were quoted at $400 and $300 for band and orchestral jobs, respectively. The average minor band repair took two hours to complete, whereas the average minor orchestral repair took four hours to complete. 2. All three partners drew annual base salaries of $60,000 plus bonuses of 5 percent of sales revenue. 3. The hourly employees were paid $20 an hour for work performed. 4. The salaried employees were paid annual base salaries of $38,000. To the extent that the number of minor orchestral repairs exceeded 1,560, the orchestral repairers were paid a flat rate of $80 per job to complete those repairs. 5. Replacement parts and other supplies were budgeted at $50 for each major job and $10 for each minor job (including rush jobs), based on experience. 6. Approximately 35 percent of the instruments that the Squeaky Horn worked on were shipped to the shop from out of town. The company expected to incur average shipping charges of $30 per package to ship the instruments back to their owners. 7. Advertising, depreciation, office rent, and miscellaneous expenses were budgeted as fixed expenses. Actual Results for the Year At the end of the year, Decker's CPA prepared the actual operating-profit statement shown in the last column of Exhibit 1. Although Decker knew the Squeaky Horn had experienced significant changes during the past year, he was still shocked to discover that the company's profit was $50,745 less than planned even though revenues had increased by $7,770. In order to understand fully the decrease in profits, Decker sat down and compiled the following information: 1. Owing to increased competition, minor band repairs were billed at $30 an hour, and minor orchestral repairs were billed $28 an hour. 2. Planned versus actual jobs and average hours per job were as follows: Job Type Band major repairs Band minor repairs Orchestral major repairs Orchestral minor repairs Rush jobs Plan Volume No. of Jobs 390 1,830 540 1,560 50 Plan Hrs./Job 7.0 2.0 6.0 4.0 3.0 Actual Volume No. of Jobs 450 1,740 510 1,650 55 Actual Hrs./Job 7.0 3.0 7.0 3.6 2.8 Total 4,370 4,405 3. On average, major repairs and restorations required more replacement parts than in past years. Therefore, replacement-parts expenses for major repairs increased an average of $10 per job for the year. In addition, shipping expenses increased by approximately $5 per package. 4. Advertising expenses were $500 more than budgeted owing to an unplanned printing of flyers for band camp. Miscellaneous expenses, however, were $100 less than budgeted. THE SQUEAKY HORN Schedule of Planned versus Actual Operating Results Plan Actual Revenue $ 656,400 $ 664,170 Owner Salaries - Base Owner Salaries - Bonus Band Repairers Wages Orchestral Repairers Salaries Rush Job Wages Replacement Parts Delivery Contribution 180,000 32,820 73,200 114,000 3,750 80,900 45,885 125,845 180,000 33,209 104,400 121,200 3,850 92,050 53,961 75,500 Advertising Depreciation Office Rent Miscellaneous 12,000 3,600 48,000 4,500 12,500 3,600 48,000 4,400 Profit $ 57,745 $ 7,000 The Annual Operating Plan At the beginning of the current year, Decker's CPA had prepared the annual operating plan for the Squeaky Horn (Exhibit 1). The Squeaky Horn's business was small and relatively straightforward, which enabled the CPA to develop the company's operating budget using specific volume and revenue data for each product line. The following information was used in preparing the annual plan: 1. Based on prior years' work orders, the shop was expected to perform the following number of jobs in the coming year: 390 major band repairs, 1,830 minor band repairs, 540 major orchestral repairs, 1,560 minor orchestral repairs, and 50 rush jobs. Average major repairs were quoted at $400 and $300 for band and orchestral jobs, respectively. The average minor band repair took two hours to complete, whereas the average minor orchestral repair took four hours to complete. 2. All three partners drew annual base salaries of $60,000 plus bonuses of 5 percent of sales revenue. 3. The hourly employees were paid $20 an hour for work performed. 4. The salaried employees were paid annual base salaries of $38,000. To the extent that the number of minor orchestral repairs exceeded 1,560, the orchestral repairers were paid a flat rate of $80 per job to complete those repairs. 5. Replacement parts and other supplies were budgeted at $50 for each major job and $10 for each minor job (including rush jobs), based on experience. 6. Approximately 35 percent of the instruments that the Squeaky Horn worked on were shipped to the shop from out of town. The company expected to incur average shipping charges of $30 per package to ship the instruments back to their owners. 7. Advertising, depreciation, office rent, and miscellaneous expenses were budgeted as fixed expenses. Actual Results for the Year At the end of the year, Decker's CPA prepared the actual operating-profit statement shown in the last column of Exhibit 1. Although Decker knew the Squeaky Horn had experienced significant changes during the past year, he was still shocked to discover that the company's profit was $50,745 less than planned even though revenues had increased by $7,770. In order to understand fully the decrease in profits, Decker sat down and compiled the following information: 1. Owing to increased competition, minor band repairs were billed at $30 an hour, and minor orchestral repairs were billed $28 an hour. 2. Planned versus actual jobs and average hours per job were as follows: Job Type Band major repairs Band minor repairs Orchestral major repairs Orchestral minor repairs Rush jobs Plan Volume No. of Jobs 390 1,830 540 1,560 50 Plan Hrs./Job 7.0 2.0 6.0 4.0 3.0 Actual Volume No. of Jobs 450 1,740 510 1,650 55 Actual Hrs./Job 7.0 3.0 7.0 3.6 2.8 Total 4,370 4,405 3. On average, major repairs and restorations required more replacement parts than in past years. Therefore, replacement-parts expenses for major repairs increased an average of $10 per job for the year. In addition, shipping expenses increased by approximately $5 per package. 4. Advertising expenses were $500 more than budgeted owing to an unplanned printing of flyers for band camp. Miscellaneous expenses, however, were $100 less than budgeted. THE SQUEAKY HORN Schedule of Planned versus Actual Operating Results Plan Actual Revenue $ 656,400 $ 664,170 Owner Salaries - Base Owner Salaries - Bonus Band Repairers Wages Orchestral Repairers Salaries Rush Job Wages Replacement Parts Delivery Contribution 180,000 32,820 73,200 114,000 3,750 80,900 45,885 125,845 180,000 33,209 104,400 121,200 3,850 92,050 53,961 75,500 Advertising Depreciation Office Rent Miscellaneous 12,000 3,600 48,000 4,500 12,500 3,600 48,000 4,400 Profit $ 57,745 $ 7,000


 Which expenses are responsible of the difference between the planned and actual profit and why the expense is higher than expected? (Find the static budget variances)


