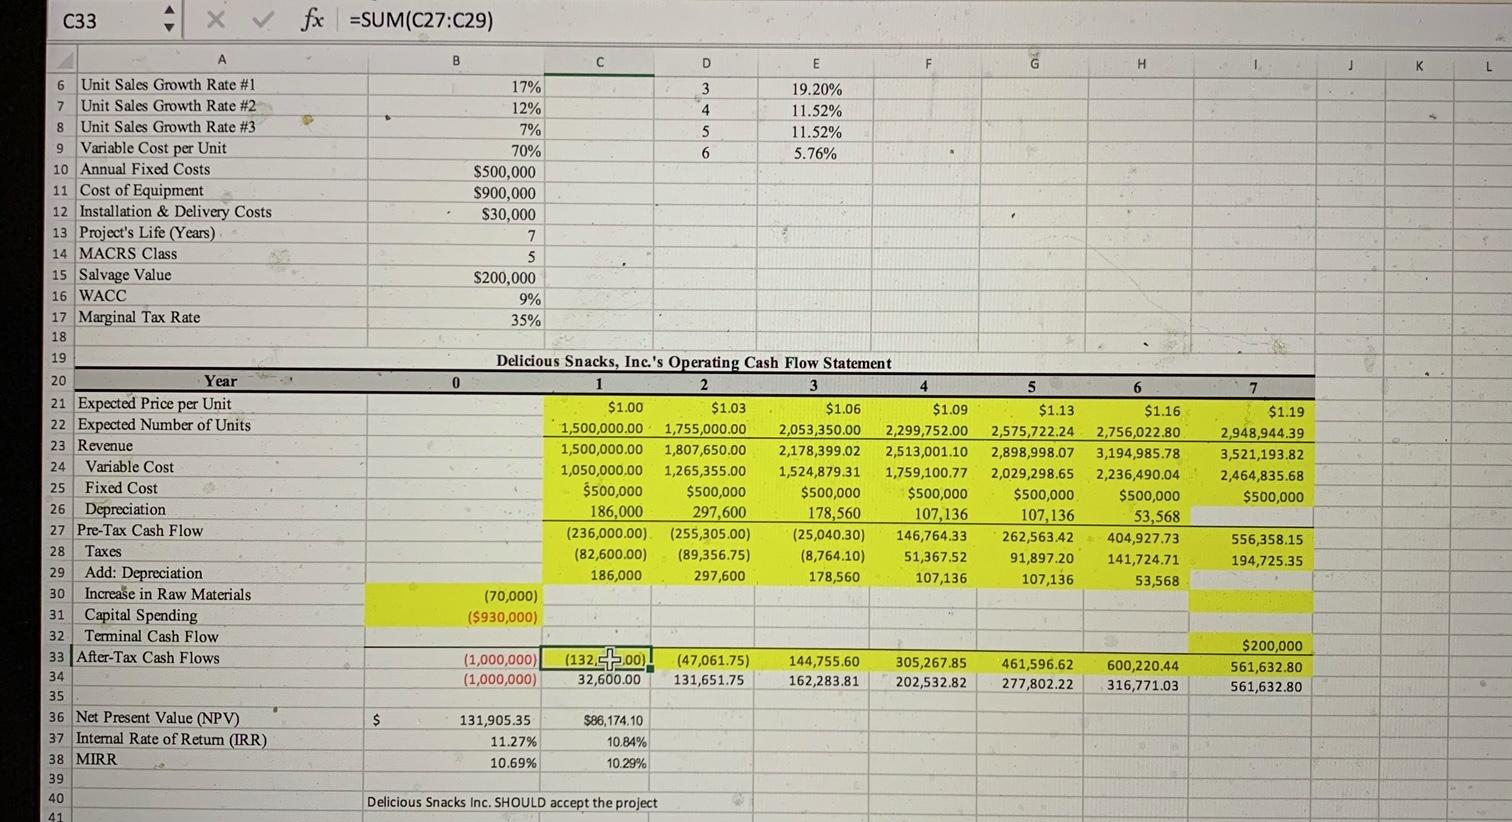
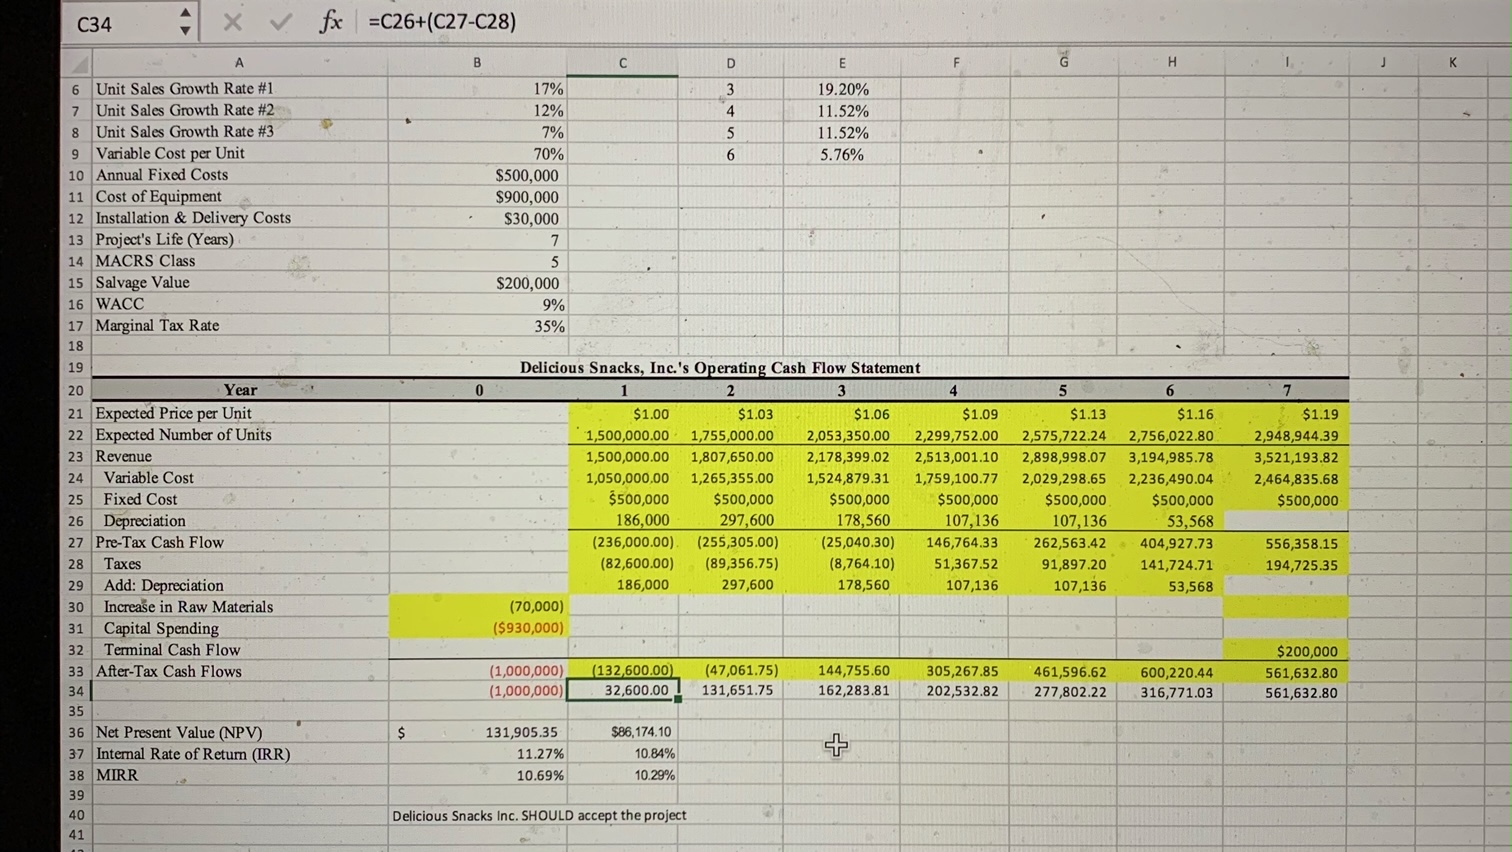
Which formula is correct? All of the work is done, but I do not know which formula is the correct formula for the "After Tax Cash Flows" row. I originally had the formulas written in A33 which was =SUM(C27:C29), but then someone pointed out that it was actually =C26+(C27-C28), so I redid the formula in row A34 and the answers are there. I will post a picture of the answers side-by-side with the formula in the top of the page to see. Please let me know which picture/formula is the correct formula.


C33 4 x fx =SUM(C27:C29) B C D E H J L 3 4 19.20% 11.52% 11.52% 5.76% 5 6 17% 12% 7% 70% $500,000 $900,000 $30,000 7 5 $200,000 9% 35% 0 5 6 7 6 Unit Sales Growth Rate #1 7 Unit Sales Growth Rate #2 8 Unit Sales Growth Rate #3 9 Variable Cost per Unit 10 Annual Fixed Costs 11 Cost of Equipment 12 Installation & Delivery Costs 13 Project's Life (Years) 14 MACRS Class 15 Salvage Value 16 WACC 17 Marginal Tax Rate 18 19 20 Year 21 Expected Price per Unit 22 Expected Number of Units 23 Revenue 24 Variable Cost 25 Fixed Cost 26 Depreciation 27 Pre-Tax Cash Flow 28 Taxes 29 Add: Depreciation 30 Increase in Raw Materials 31 Capital Spending 32 Terminal Cash Flow 33 After-Tax Cash Flows 34 35 36 Net Present Value (NPV) 37 Internal Rate of Retum (IRR) 38 MIRR 39 40 41 Delicious Snacks, Inc.'s Operating Cash Flow Statement 3 4 $1.00 $1.03 $1.06 $1.09 1,500,000.00 1,755,000.00 2,053,350.00 2,299,752.00 1,500,000.00 1,807,650.00 2,178,399.02 2,513,001.10 1,050,000.00 1,265,355.00 1,524,879.31 1,759,100.77 $500,000 $500,000 $500,000 $500,000 186,000 297,600 178,560 107,136 (236,000.00) (255,305.00) (25,040.30) 146,764.33 (82,600.00) (89,356.75) (8,764.10) 51,367.52 186,000 297,600 178,560 107,136 (70,000) ($930,000) $1.13 2,575,722.24 2,898,998.07 2,029,298.65 $500,000 107,136 262,563.42 91,897.20 107,136 $1.16 2,756,022.80 3,194,985.78 2,236,490.04 $500,000 53,568 404,927.73 141,724.71 53,568 $1.19 2,948,944.39 3,521,193.82 2,464,835.68 $500,000 556,358.15 194,725.35 (1,000,000) (1,000,000) (132,5+00). 32,600.00 (47,061.75) 131,651.75 144,755.60 162,283.81 305,267.85 202,532.82 461,596.62 277,802.22 600,220.44 316,771.03 $200,000 561,632.80 561,632.80 $ 131,905.35 11.27% 10.69% $86,174.10 10.84% 10.29% Delicious Snacks Inc. SHOULD accept the project C34 4 x fx =C26+(C27-C28) A B C D E F G H I 17% 3 4 19.20% 11.52% 11.52% 5.76% 5 6 6 Unit Sales Growth Rate #1 7 Unit Sales Growth Rate #2 8 Unit Sales Growth Rate #3 9 Variable Cost per Unit 10 Annual Fixed Costs 11 Cost of Equipment 12 Installation & Delivery Costs 13 Project's Life (Years) 14 MACRS Class 15 Salvage Value 16 WACC 17 Marginal Tax Rate 18 12% 7% 70% $500,000 $900,000 $30,000 7 5 $200,000 9% 35% 0 Delicious Snacks, Inc.'s Operating Cash Flow Statement 1 2 3 4 $1.00 $1.03 $1.06 $1.09 1,500,000.00 1,755,000.00 2,053,350.00 2,299,752.00 1,500,000.00 1,807,650.00 2,178,399.02 2,513,001.10 1,050,000.00 1,265,355.00 1,524,879.31 1,759,100.77 $500,000 $500,000 $500,000 $500,000 186,000 297,600 178,560 107,136 (236,000.00) (255,305.00) (25,040.30) 146,764.33 (82,600.00) (89,356.75) (8,764.10) 51,367.52 186,000 297,600 178,560 107,136 (70,000) ($930,000) 5 6 $1.13 $1.16 2,575,722.24 2,756,022.80 2,898,998.07 3,194,985.78 2,029,298.65 2,236,490.04 $500,000 $500,000 107,136 53,568 262,563.42 404,927.73 91,897.20 141,724.71 107,136 53,568 7 $1.19 2,948,944.39 3,521,193.82 2,464,835.68 $500,000 19 20 Year 21 Expected Price per Unit 22 Expected Number of Units 23 Revenue 24 Variable Cost 25 Fixed Cost Depreciation 27 Pre-Tax Cash Flow 28 Taxes 29 Add: Depreciation 30 Increase in Raw Materials 31 Capital Spending 32 Terminal Cash Flow 33 After-Tax Cash Flows 34 35 36 Net Present Value (NPV) 37 Internal Rate of Return (IRR) 38 MIRR 39 26 556,358.15 194,725.35 (1,000,000) (1,000,000) (132,600.00) 32,600.00 (47,061.75) 131,651.75 144,755.60 162,283.81 305,267.85 202,532.82 461,596.62 277,802.22 600,220.44 316,771.03 $200,000 561,632.80 561,632.80 $ 131,905.35 11.27% 10.69% $86,174.10 10.84% 10.29% 40 Delicious Snacks Inc. SHOULD accept the project 41


