

Answered step by step
Verified Expert Solution
Question
1 Approved Answer
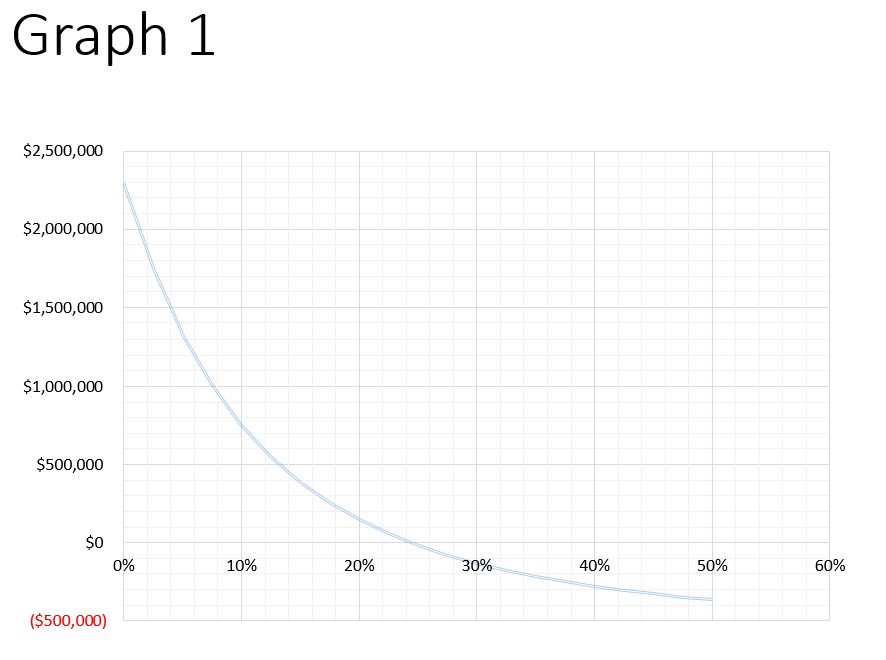
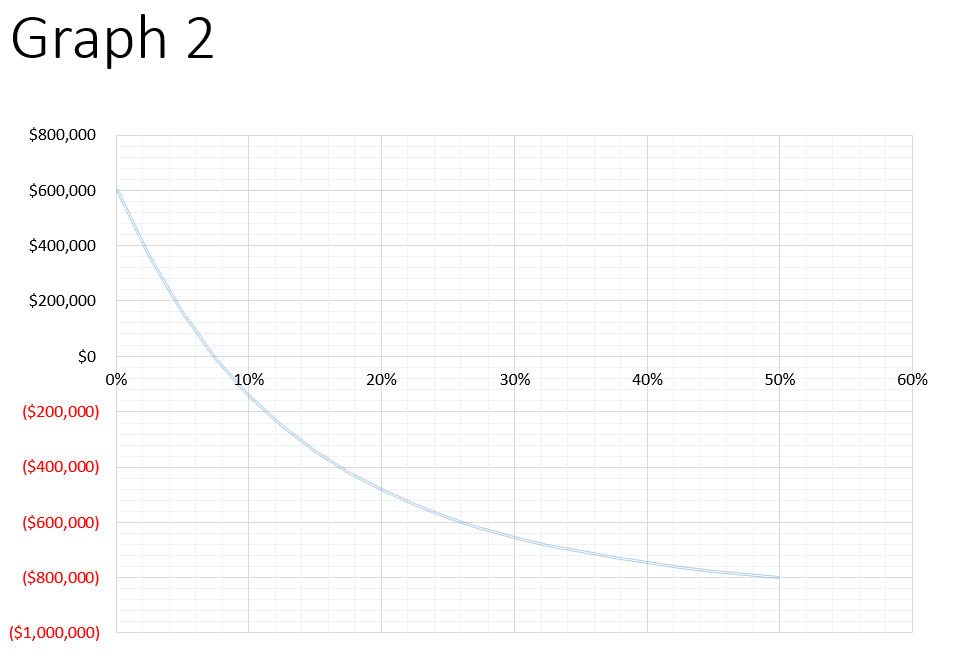
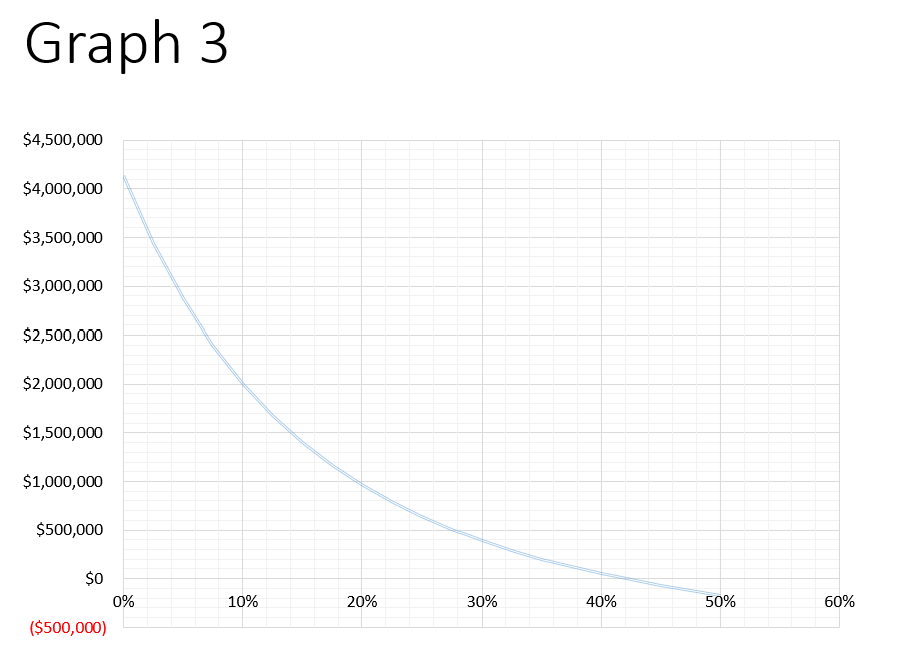
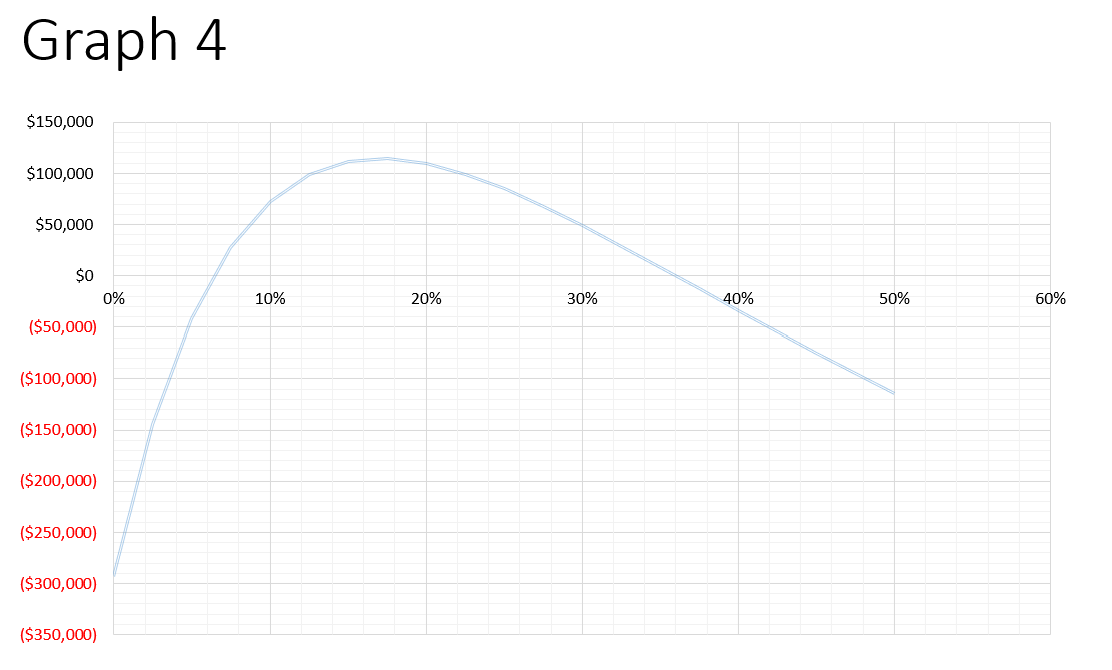
Which graph shows the net present worth of Project X at various rates of interest from 0% to 50%? Years Project X 0 -$770,040 1
Which graph shows the net present worth of Project X at various rates of interest from 0% to 50%?
| Years | Project X |
| 0 | -$770,040 |
| 1 | -$347,490 |
| 2 | $143,612 |
| 3 | $143,612 |
| 4 | $143,612 |
| 5 | $143,612 |
| 6 | $168,239 |
| 7 | $168,239 |
| 8 | $365,479 |
| 9 | $218,287 |
| 10 | $229,202 |
Answer choices:
Graph 1
Graph 2
Graph 3
Graph 4
Graph 1 Graph 2 Graph 3 Graph 4Step by Step Solution
There are 3 Steps involved in it
Step: 1

Get Instant Access to Expert-Tailored Solutions
See step-by-step solutions with expert insights and AI powered tools for academic success
Step: 2

Step: 3
Ace Your Homework with AI
Get the answers you need in no time with our AI-driven, step-by-step assistance
Get Started
Chatgpt And Future Of Blockchain
Authors: Richard Thumser
1st Edition
979-8370852664