Answered step by step
Verified Expert Solution
Question
1 Approved Answer
Which of the answers below is the most likely explanation for the following discrepancy. Suppose we have a comparison of 3 means. The sample sizes
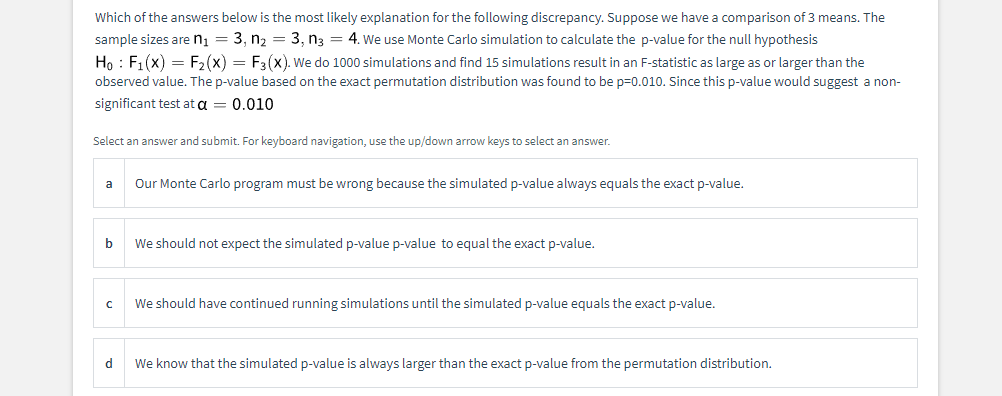
Which of the answers below is the most likely explanation for the following discrepancy. Suppose we have a comparison of 3 means. The sample sizes are nj = 3, n2 = 3, n3 = 4. We use Monte Carlo simulation to calculate the p-value for the null hypothesis Ho : F1(x) = F2(X) = F3(X). We do 1000 simulations and find 15 simulations result in an F-statistic as large as or larger than the observed value. The p-value based on the exact permutation distribution was found to be p=0.010. Since this p-value would suggest a non- significant test at a = 0.010 Select an answer and submit. For keyboard navigation, use the up/down arrow keys to select an answer. a Our Monte Carlo program must be wrong because the simulated p-value always equals the exact p-value. b We should not expect the simulated p-value p-value to equal the exact p-value. C We should have continued running simulations until the simulated p-value equals the exact p-value. d We know that the simulated p-value is always larger than the exact p-value from the permutation distribution
Step by Step Solution
There are 3 Steps involved in it
Step: 1
Get Instant Access to Expert-Tailored Solutions
See step-by-step solutions with expert insights and AI powered tools for academic success
Step: 2
Step: 3
Ace Your Homework with AI
Get the answers you need in no time with our AI-driven, step-by-step assistance
Get Started