Answered step by step
Verified Expert Solution
Question
1 Approved Answer
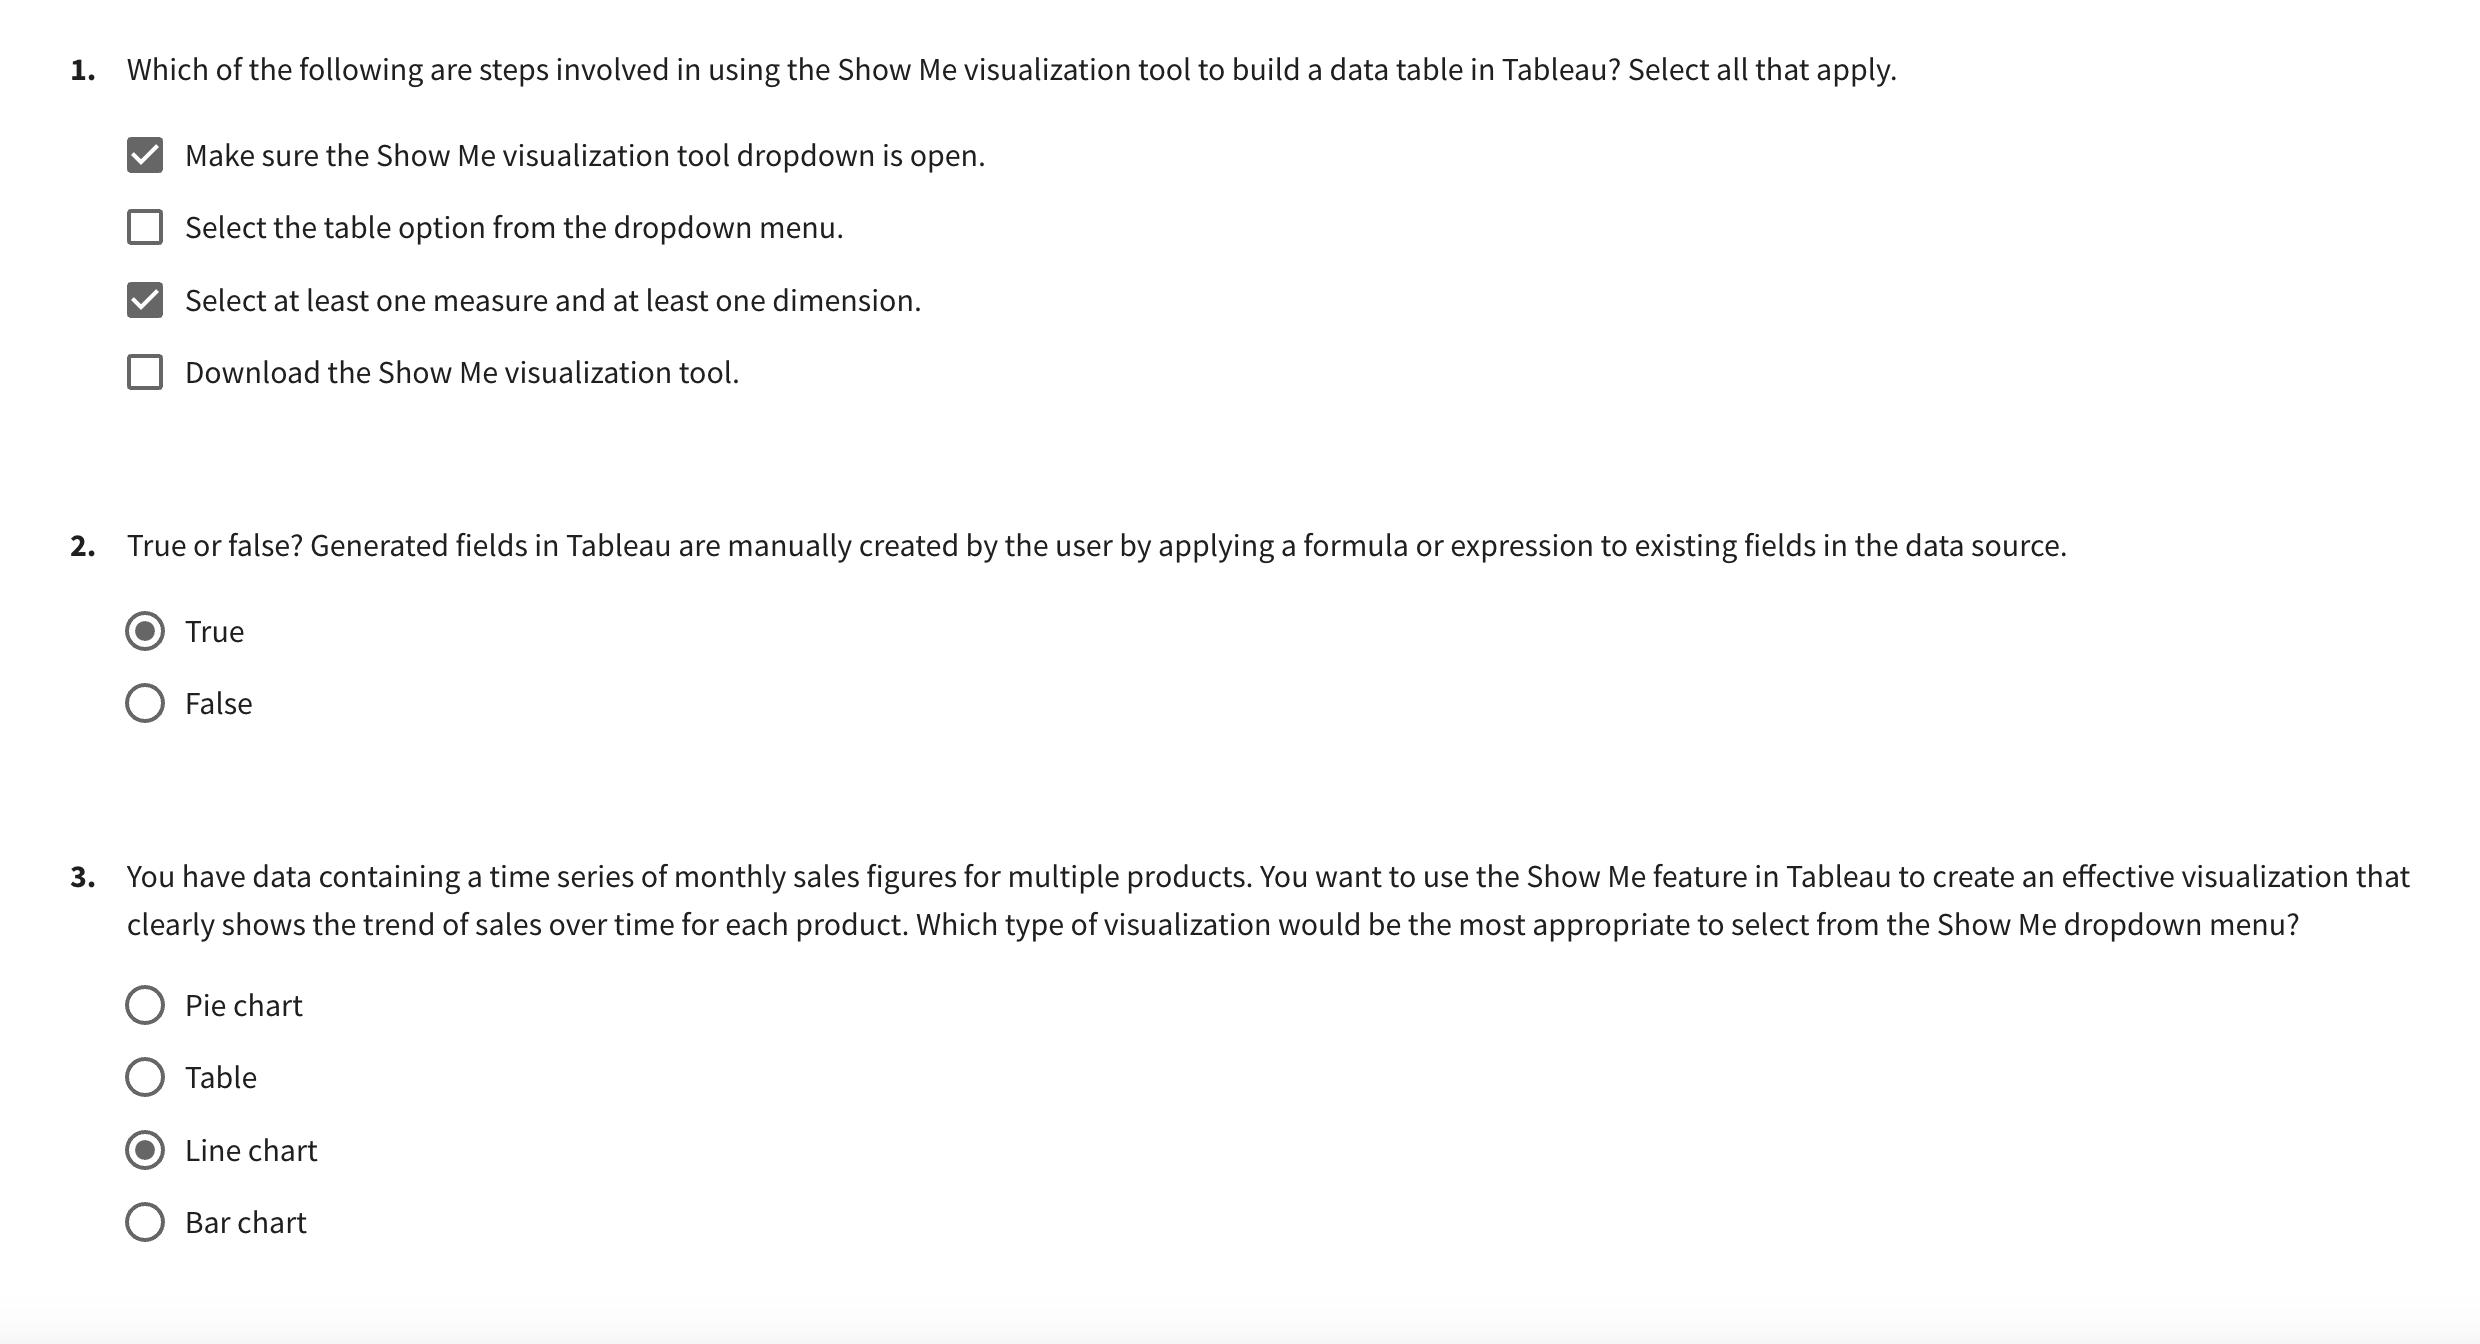
Which of the following are steps involved in using the Show Me visualization tool to build a data table in Tableau? Select all that apply.
Which of the following are steps involved in using the Show Me visualization tool to build a data table in Tableau? Select all that apply.
Make sure the Show Me visualization tool dropdown is open.
Select the table option from the dropdown menu.
Select at least one measure and at least one dimension.
Download the Show Me visualization tool.
True or false? Generated fields in Tableau are manually created by the user by applying a formula or expression to existing fields in the data source.
True
False
You have data containing a time series of monthly sales figures for multiple products. You want to use the Show Me feature in Tableau to create an effective visualization that
clearly shows the trend of sales over time for each product. Which type of visualization would be the most appropriate to select from the Show Me dropdown menu?
Pie chart
Table
Line chart
Bar chart

Step by Step Solution
There are 3 Steps involved in it
Step: 1

Get Instant Access to Expert-Tailored Solutions
See step-by-step solutions with expert insights and AI powered tools for academic success
Step: 2

Step: 3

Ace Your Homework with AI
Get the answers you need in no time with our AI-driven, step-by-step assistance
Get Started


