Answered step by step
Verified Expert Solution
Link Copied!

Question

1 Approved Answer

Which one of the following statements is FALSE regarding parametric and nonparametric classification types of statistical tests? Select one: O a. The chi square test
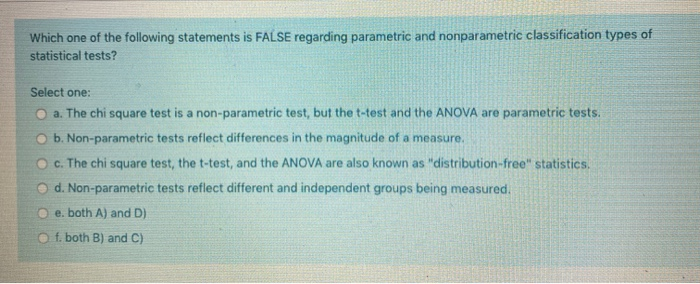
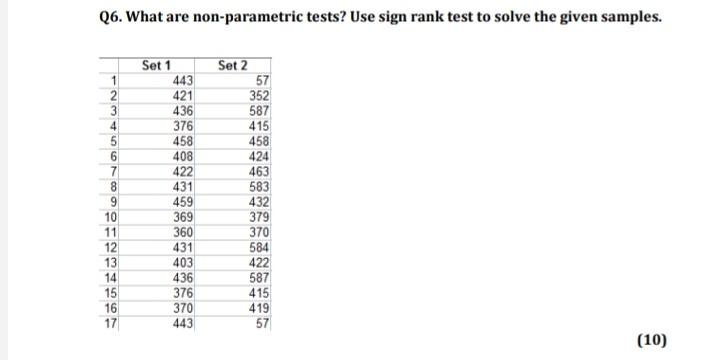
image text in transcribedimage text in transcribedimage text in transcribedimage text in transcribed
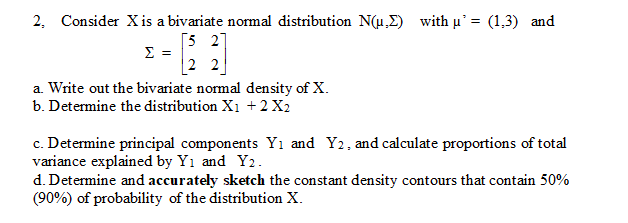
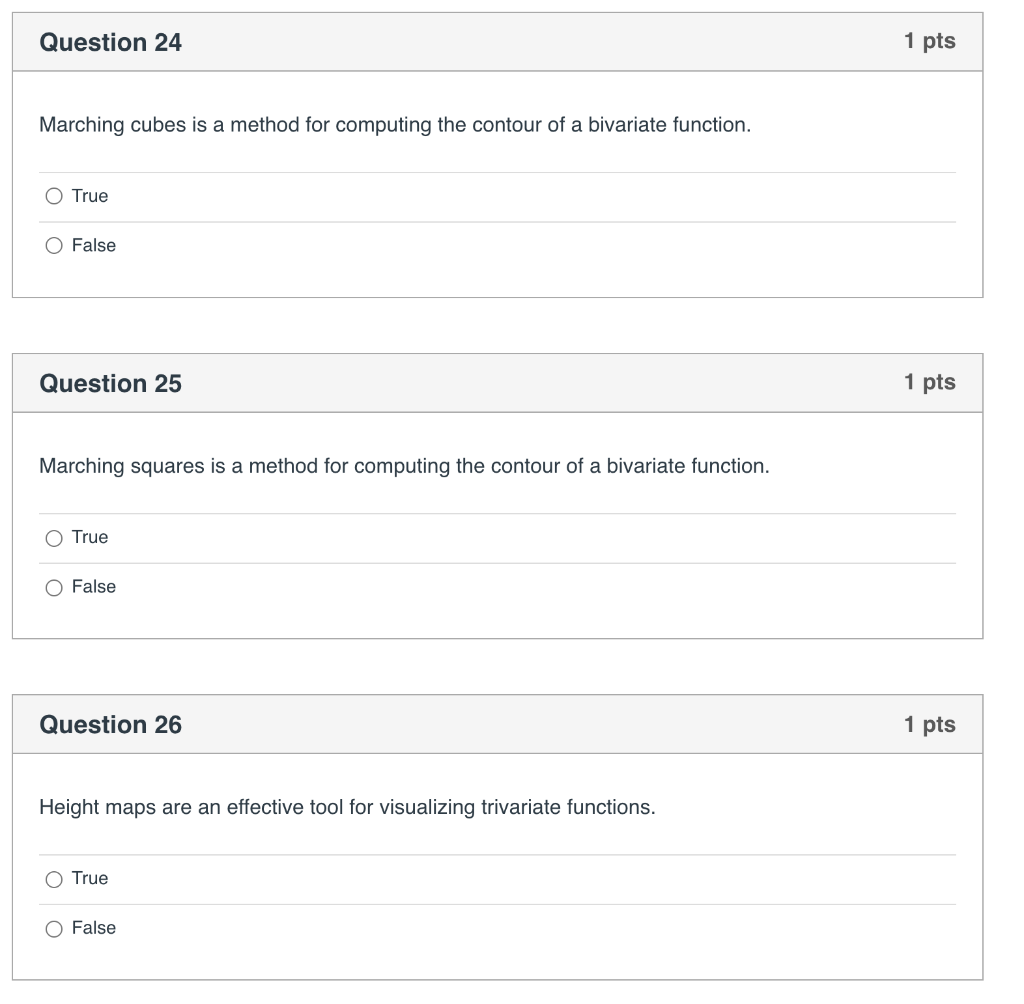
Which one of the following statements is FALSE regarding parametric and nonparametric classification types of statistical tests? Select one: O a. The chi square test is a non-parametric test, but the t-test and the ANOVA are parametric tests. O b. Non-parametric tests reflect differences in the magnitude of a measure. O c. The chi square test, the t-test, and the ANOVA are also known as "distribution-free" statistics. O d. Non-parametric tests reflect different and independent groups being measured. O e. both A) and D) Of. both B) and C)Q6. What are non-parametric tests? Use sign rank test to solve the given samples. Set 1 Set 2 443 57 421 352 436 587 376 415 458 458 408 424 422 463 431 583 459 432 369 379 11 360 370 12 431 584 13 403 422 14 436 587 15 376 415 16 370 419 17 443 57 (10)Q6. What are non-parametric tests? Use sign rank test to solve the given samples. Set 1 Set 2 443 57 421 352 436 587 376 415 458 458 408 424 422 463 431 583 459 432 369 379 11 360 370 12 431 584 13 403 422 14 436 587 15 376 415 16 370 419 17 443 57 (10)Question 24 1 pts Marching cubes is a method for computing the contour of a bivariate function. O True O False Question 25 1 pts Marching squares is a method for computing the contour of a bivariate function. O True O False Question 26 1 pts Height maps are an effective tool for visualizing trivariate functions. O True O False2, Consider X is a bivariate normal distribution N(p,)) with u' = (1,3) and 2 E = : 2 a. Write out the bivariate normal density of X. b. Determine the distribution X1 + 2 X2 c. Determine principal components Y1 and Y2, and calculate proportions of total variance explained by Y1 and Y2. d. Determine and accurately sketch the constant density contours that contain 50% (90%) of probability of the distribution X
Step by Step Solution

There are 3 Steps involved in it

Step: 1

blur-text-image

Get Instant Access to Expert-Tailored Solutions

See step-by-step solutions with expert insights and AI powered tools for academic success

Step: 2

blur-text-image

Step: 3

blur-text-image

Ace Your Homework with AI

Get the answers you need in no time with our AI-driven, step-by-step assistance

Get Started

Recommended Textbook for

Precalculus, Enhanced

Authors: Cynthia Y Young

3rd Edition

1119339510, 9781119339519

More Books

Students also viewed these Mathematics questions

Question

Explain the chemical properties of acids with examples.

Answered: 1 week ago

Question

Write the properties of Group theory.

Answered: 1 week ago