

Answered step by step
Verified Expert Solution
Question
1 Approved Answer
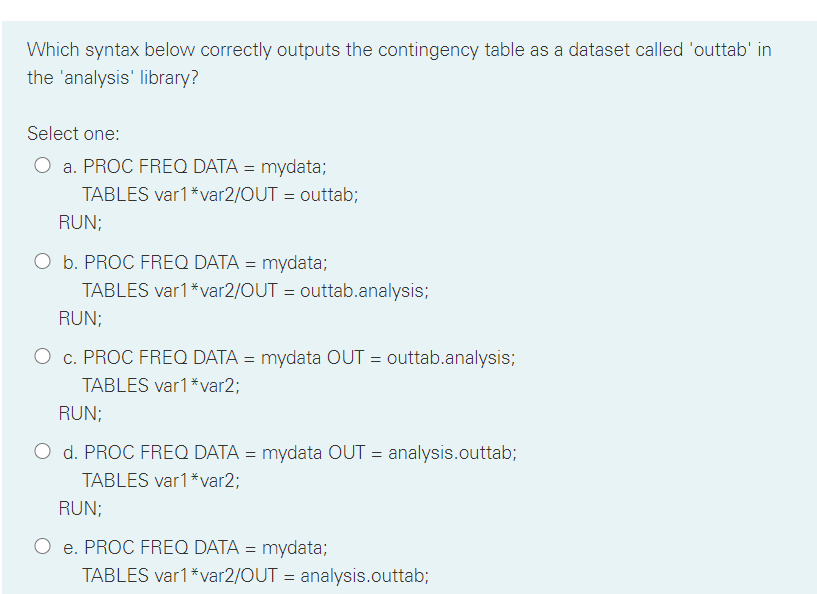
Which syntax below correctly outputs the contingency table as a dataset called 'outtab' in the 'analysis' library? Select one: O a. PROC FREQ DATA =
Step by Step Solution
There are 3 Steps involved in it
Step: 1

Get Instant Access to Expert-Tailored Solutions
See step-by-step solutions with expert insights and AI powered tools for academic success
Step: 2

Step: 3
Ace Your Homework with AI
Get the answers you need in no time with our AI-driven, step-by-step assistance
Get Started
Pro Database Migration To Azure Data Modernization For The Enterprise
Authors: Kevin Kline, Denis McDowell, Dustin Dorsey, Matt Gordon
1st Edition
1484282299, 978-1484282298