Answered step by step
Verified Expert Solution
Question
1 Approved Answer
Who can slove those questions and jornal entry?and compare straight line ,double Declining balance and make a Line Chart?thanks Excel Assignment 1_DEPRECIATION Double-declining-balance Methods .
Who can slove those questions and jornal entry?and compare straight line ,double Declining balance and make a Line Chart?thanks 


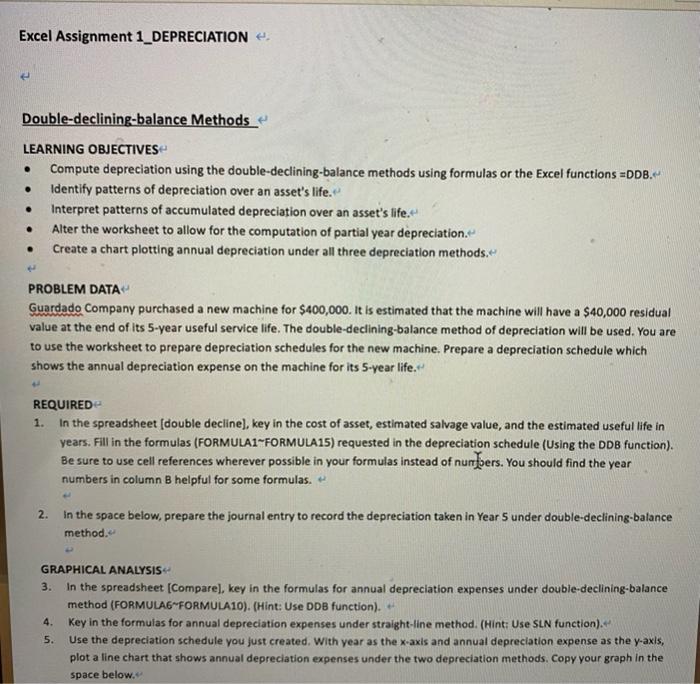
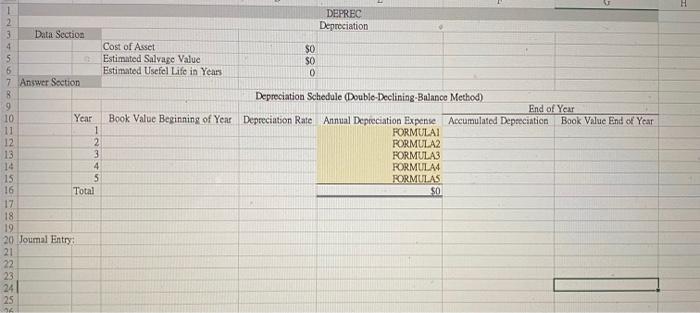
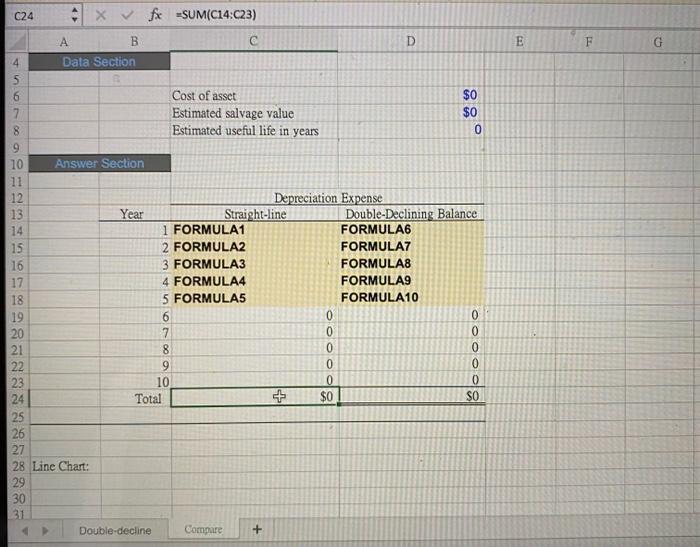
Excel Assignment 1_DEPRECIATION Double-declining-balance Methods . . LEARNING OBJECTIVES Compute depreciation using the double-declining-balance methods using formulas or the Excel functions =DDB. Identify patterns of depreciation over an asset's life. Interpret patterns of accumulated depreciation over an asset's life. Alter the worksheet to allow for the computation of partial year depreciation. Create a chart plotting annual depreciation under all three depreciation methods. . . . PROBLEM DATA Guardado Company purchased a new machine for $400,000. It is estimated that the machine will have a $40,000 residual value at the end of its 5-year useful service life. The double-declining-balance method of depreciation will be used. You are to use the worksheet to prepare depreciation schedules for the new machine. Prepare a depreciation schedule which shows the annual depreciation expense on the machine for its 5-year life. REQUIRED 1. In the spreadsheet (double decline), key in the cost of asset, estimated salvage value, and the estimated useful life in years. Fill in the formulas (FORMULA1-FORMULA15) requested in the depreciation schedule (Using the DDB function). Be sure to use cell references wherever possible in your formulas instead of numbers. You should find the year numbers in column B helpful for some formulas. 2. in the space below, prepare the journal entry to record the depreciation taken in Year S under double-declining-balance method. GRAPHICAL ANALYSIS 3. In the spreadsheet (Compare), key in the formulas for annual depreciation expenses under double-declining-balance method (FORMULAG FORMULA10). (Hint: Use DDB function). 4. Key in the formulas for annual depreciation expenses under straight-line method. (Hint: Use SLN function). 5. Use the depreciation schedule you just created. With year as the x-axis and annual depreciation expense as the y-axls, plot a line chart that shows annual depreciation expenses under the two depreciation methods. Copy your graph in the space below. H 1 DEPREC Depreciation Data Section Cost of Asset Estimated Salvage Value Estimated Usefel Life in Years $0 SO 0 7 Answer Section Book Value Beginning of Year muro 49928 Depreciation Schedule (Double-Declining Balance Method) End of Year Depreciation Rate Annual Depreciation Expense Accumulated Depreciation Book Value End of Year FORMULAI FORMULA FORMULA FORMULA FORMULAS SO 10 Year 1 12 2 3 4 5 16 Total 17 18 19 20 Joumal Entry 21 22 23 24 25 C24 4 x fx =SUM(C14:C23) D E F G A B Data Section A 4 Cost of asset $0 7 Estimated salvage value $0 8 Estimated useful life in years 0 9 10 Answer Section 11 12 Depreciation Expense 13 Year Straight-line Double-Declining Balance 14 1 FORMULA1 FORMULA6 15 2 FORMULA2 FORMULA7 16 3 FORMULA3 FORMULAS 17 4 FORMULA4 FORMULAS 18 5 FORMULA5 FORMULA 10 19 6 0 0 20 7 0 0 21 8 0 0 22 9 0 0 23 10 0 0 24 Total + $0 SO 25 26 27 28 Line Chart: 29 30 31 Double-decline Compare + + 


Step by Step Solution
There are 3 Steps involved in it
Step: 1

Get Instant Access to Expert-Tailored Solutions
See step-by-step solutions with expert insights and AI powered tools for academic success
Step: 2

Step: 3

Ace Your Homework with AI
Get the answers you need in no time with our AI-driven, step-by-step assistance
Get Started


