

Answered step by step
Verified Expert Solution
Question
1 Approved Answer
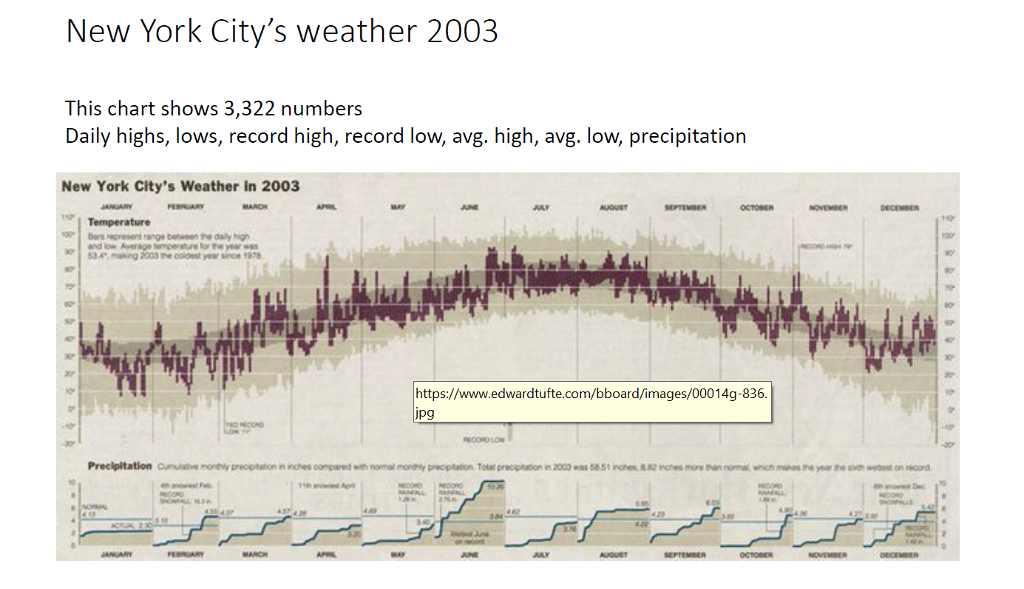
Why following historical visualizations covered under graphical excellence impressed you the most? New York City's weather 2003 This chart shows 3,322 numbers Daily highs, lows,
Why following historical visualizations covered under graphical excellence impressed you the most?
Step by Step Solution
There are 3 Steps involved in it
Step: 1

Get Instant Access to Expert-Tailored Solutions
See step-by-step solutions with expert insights and AI powered tools for academic success
Step: 2

Step: 3
Ace Your Homework with AI
Get the answers you need in no time with our AI-driven, step-by-step assistance
Get Started
Scientific And Statistical Database Management 21st International Conference Ssdbm 2009 New Orleans La Usa June 2009 Proceedings Lncs 5566
Authors: Marianne Winslett
2009th Edition
3642022782, 978-3642022784