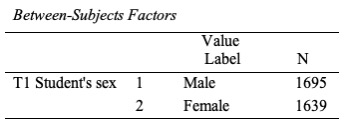
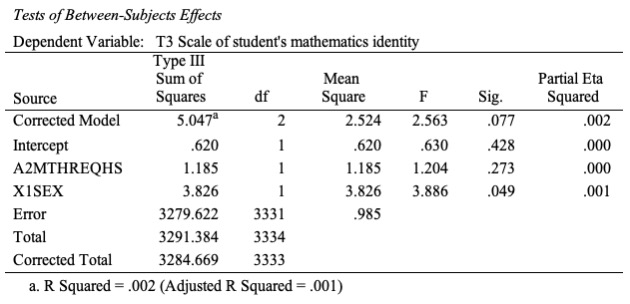
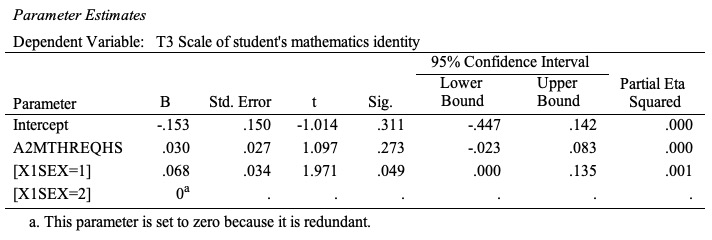
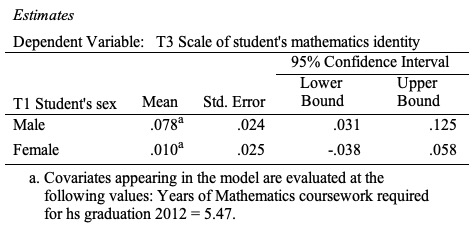
Why is ANCOVA the appropriate analysis design when looking at student's math identity but consider if there is a difference in number of math classes taken during high school between gender while controlling for math identity?
\fTests of Between-Subjects Effects Dependent Variable: T3 Scale of student's mathematics identity Type III Sum of Mean Partial Eta Source Squares df Square F Sig. Squared Corrected Model 5.047 2 2.524 2.563 .077 .002 Intercept .620 .620 .630 .428 .000 A2MTHREOHS 1.185 1.185 1.204 .273 .000 XISEX 3.826 3.826 3.886 .049 001 Error 3279.622 3331 .985 Total 3291.384 3334 Corrected Total 3284.669 3333 a. R Squared = .002 (Adjusted R Squared = .001)Parameter Estimates Dependent Variable: T3 Scale of student's mathematics identity 95% Confidence Interval Lower Upper Partial Eta Parameter B Std. Error Sig. Bound Bound Squared Intercept -.153 150 -1.014 311 -.447 .142 .000 A2MTHREQHS 030 027 1.097 273 -.023 083 000 [XISEX=1] 068 .034 1.971 049 000 .135 001 [XISEX=2] 0a a. This parameter is set to zero because it is redundant.Estimates Dependent Variable: T3 Scale of student's mathematics identity 95% Confidence Interval Lower Upper T1 Student's sex Mean Std. Error Bound Bound Male 078 024 031 125 Female .010# 025 -.038 058 a. Covariates appearing in the model are evaluated at the following values: Years of Mathematics coursework required for hs graduation 2012 = 5.47.Pairwise Comparisons Dependent Variable: T3 Scale of student's mathematics identity 95% Confidence Interval Mean for Difference Difference Lower Upper (I) TI Student's sex (J) T1 Student's sex (I-J) Std. Error Sig. Bound Bound Male Female .068 034 049 000 .135 Female Male -.068 034 .049 -.135 .000 Based on estimated marginal means *. The mean difference is significant at the .05 level. b. Adjustment for multiple comparisons: Bonferroni.Univariate Tests Dependent Variable: T3 Scale of student's mathematics identity Sum of Mean Partial Eta Squares df Square F Sig. Squared Contrast 3.826 3.826 3.886 049 001 Error 3279.622 3331 .985 The F tests the effect of TI Student's sex. This test is based on the linearly independent pairwise comparisons among the estimated marginal means