Answered step by step
Verified Expert Solution
Question
1 Approved Answer
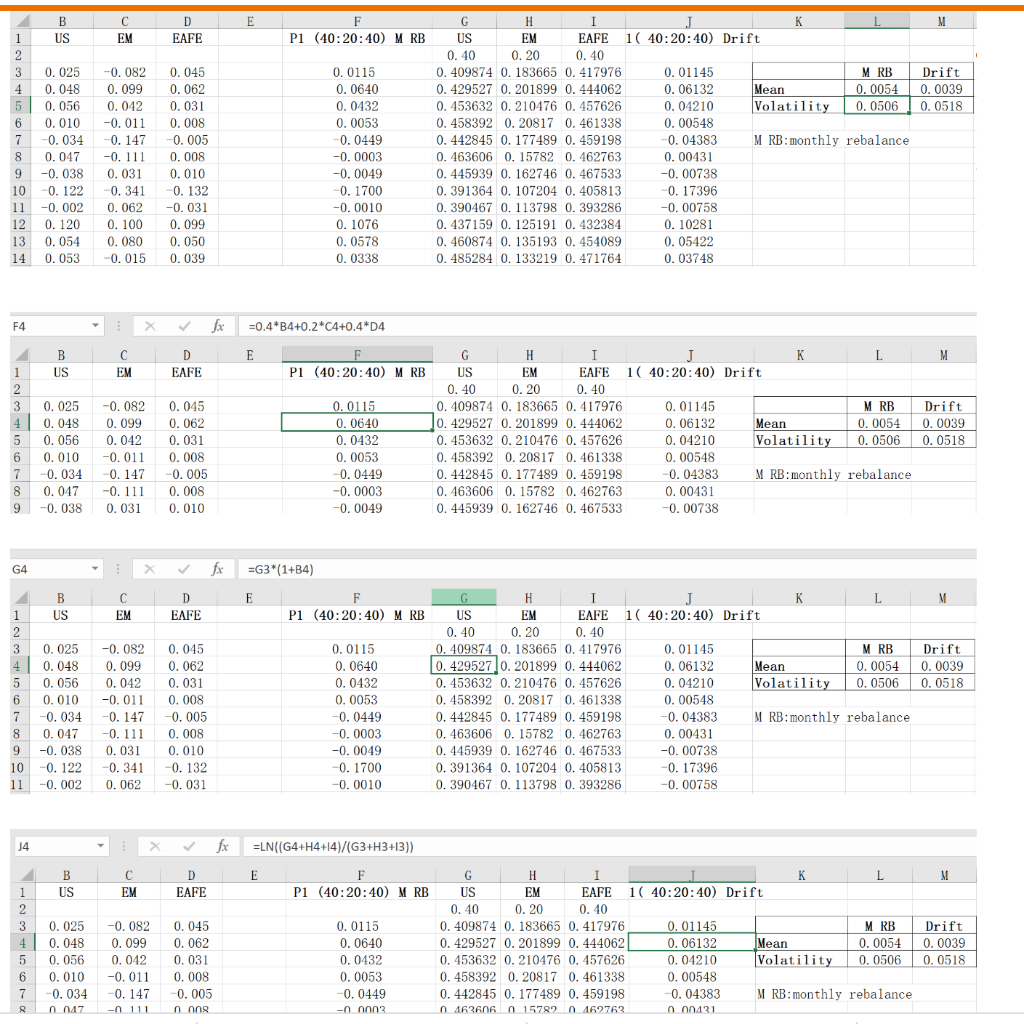
why mean return of M RB higher than drift portfolio but volatility is lower. there are no any calculation errors thanks a lot E 1

why mean return of M RB higher than drift portfolio but volatility is lower.
there are no any calculation errors
thanks a lot
E 1 B US C D EME AFE F P1 (40:20:40) M RB 3 4 5 6 7 8 9 10 11 12 13 14 0.025 0.048 0.056 0.010 -0.034 0.047 -0.038 -0. 122 -0.002 0.120 0.054 0.053 -0.082 0.099 0.042 -0.011 -0.147 -0.111 0.031 -0.341 0.062 0.100 0.080 -0.015 0.045 0.062 0.031 0.008 -0.005 0.008 0.010 -0.132 -0.031 0.099 0.050 0.039 0.0115 0.0640 0.0432 0.0053 -0.0449 -0.0003 -0.0049 -0. 1700 -0.0010 0.1076 0.0578 0.0338 US EM E AFE 1( 40:20:40) Drift 0.40 0.20 0.40 0.409874 0. 183665 0.417976 0.01145 MRB Drift 0.429527 0. 201899 0.444062 0.06132 Mean 0.0054 | 0.0039 0.453632 0.210476 0.457626 0.04210 Volatility 0.0506 0.0518 0.458392 0.20817 0.461338 0.00548 0.442845 0.177489 0.459198 -0.04383 M RB: monthly rebalance 0.463606 0.15782 0.462763 0.00431 0.445939 0.162746 0.467533 -0.00738 0.391364 0.107204 0.405813 -0. 17396 0.390467 0.113798 0.393286 -0.00758 0.437159 0.125191 0.432384 0.10281 0.460874 0.135193 0.454089 0.05422 0.485284 0.133219 0.471764 0.03748 F4 X fx =0.4*B4+0.2*C4+0.4*D4 2 E M B US C EM D EAFE 3 4 5 6 7 8 9 Drift 0.0039 0.0518 0.025 0.048 0.056 0.010 -0.034 0.047 -0.038 -0.082 0.099 0.042 -0.011 -0.147 -0.111 0.031 0.045 0.062 0.031 0.008 -.005 0.008 0.010 I P1 (40:20:40) M RB US EM E AFE 1( 40:20:40) Drift 0.40 0.20 0.40 0.0115 0.409874 0.183665 0.417976 0.01145 MRB 10.429527 0. 201899 0.444062 0.06132 Mean 0.0054 0.0432 0.453632 0.210476 0.457626 0.04210 Volatility 0.0506 0.0053 0.458392 0.20817 0.461338 0.00548 -0.0449 0.442845 0.177489 0.459198 -0.04383 M RB: monthly rebalance -0.0003 0.463606 0.15782 0.462763 0.00431 -0.0049 0.445939 0.162746 0.467533 -0.00738 fx US x D EMEAFE =G3*(1+B4) E P1 (40:20:40) M RB 1 3 0.025 4 | 0.048 5 0.056 6 0.010 7 -0.034 8 0.047 9 -0.038 10 -0. 122 11 -0.002 Drift 0.0039 0.0518 -0.082 0.099 0.042 -0.011 -0.147 -0.111 0.031 -0.341 0.062 0.045 0.062 0.031 0.008 -0.005 0.008 0.010 -0.132 -0.031 KL US E M E AFE 1( 40:20:40) Drift 0.40 0.20 0.40 0.409874 0.183665 0.417976 0.01145 MRB 0.42952710.201899 0.444062 0.06132 Mean 0.0054 0.453632 0.210476 0.457626 0.04210 Volatility 0. 0506 0.458392 0.20817 0.461338 0.00548 0.442845 0.177489 0.459198 -0.04383 M RB:monthly rebalance 0.463606 0.15782 0.462763 0.00431 0.445939 0.162746 0.467533 -0.00738 0.391364 0.107204 0.405813 -0. 17396 0.390467 0.113798 0.393286 -0.00758 0.0115 0.0640 0.0432 0.0053 -0.0449 -0.0003 -0.0049 -0. 1700 -0.0010 J4 - X fx ELN((G4+H4+14)/(G3+H3+13)) E B US C D EMEAFE P1 (40:20:40) M RB 3 4 5 6 7 8 0.025 0.048 0.056 0.010 -0.034 047 -0.082 0.099 0.042 -0.011 -0. 147 - 111 0.045 0.062 0.031 0.008 -0.005 ning Drift 0.0039 0.0518 G H I J K L US EM E AFE 1( 40:20:40) Drift 0.40 0.20 0.40 0.409874 0.183665 0. 417976 0.01145 MRB 0.429527 0.201899 0.444062 0.06132 Mean 0.0054 0.453632 0.210476 0.457626 0.04210 Volatility 0.0506 0.458392 0.20817 0.461338 0.00548 0.442845 0.177489 0.459198 -0.04383 M RB: monthly rebalance n 162606 n 15782 0462762 00421 0.0115 0.0640 0.0432 0.0053 -0.0449 -n non E 1 B US C D EME AFE F P1 (40:20:40) M RB 3 4 5 6 7 8 9 10 11 12 13 14 0.025 0.048 0.056 0.010 -0.034 0.047 -0.038 -0. 122 -0.002 0.120 0.054 0.053 -0.082 0.099 0.042 -0.011 -0.147 -0.111 0.031 -0.341 0.062 0.100 0.080 -0.015 0.045 0.062 0.031 0.008 -0.005 0.008 0.010 -0.132 -0.031 0.099 0.050 0.039 0.0115 0.0640 0.0432 0.0053 -0.0449 -0.0003 -0.0049 -0. 1700 -0.0010 0.1076 0.0578 0.0338 US EM E AFE 1( 40:20:40) Drift 0.40 0.20 0.40 0.409874 0. 183665 0.417976 0.01145 MRB Drift 0.429527 0. 201899 0.444062 0.06132 Mean 0.0054 | 0.0039 0.453632 0.210476 0.457626 0.04210 Volatility 0.0506 0.0518 0.458392 0.20817 0.461338 0.00548 0.442845 0.177489 0.459198 -0.04383 M RB: monthly rebalance 0.463606 0.15782 0.462763 0.00431 0.445939 0.162746 0.467533 -0.00738 0.391364 0.107204 0.405813 -0. 17396 0.390467 0.113798 0.393286 -0.00758 0.437159 0.125191 0.432384 0.10281 0.460874 0.135193 0.454089 0.05422 0.485284 0.133219 0.471764 0.03748 F4 X fx =0.4*B4+0.2*C4+0.4*D4 2 E M B US C EM D EAFE 3 4 5 6 7 8 9 Drift 0.0039 0.0518 0.025 0.048 0.056 0.010 -0.034 0.047 -0.038 -0.082 0.099 0.042 -0.011 -0.147 -0.111 0.031 0.045 0.062 0.031 0.008 -.005 0.008 0.010 I P1 (40:20:40) M RB US EM E AFE 1( 40:20:40) Drift 0.40 0.20 0.40 0.0115 0.409874 0.183665 0.417976 0.01145 MRB 10.429527 0. 201899 0.444062 0.06132 Mean 0.0054 0.0432 0.453632 0.210476 0.457626 0.04210 Volatility 0.0506 0.0053 0.458392 0.20817 0.461338 0.00548 -0.0449 0.442845 0.177489 0.459198 -0.04383 M RB: monthly rebalance -0.0003 0.463606 0.15782 0.462763 0.00431 -0.0049 0.445939 0.162746 0.467533 -0.00738 fx US x D EMEAFE =G3*(1+B4) E P1 (40:20:40) M RB 1 3 0.025 4 | 0.048 5 0.056 6 0.010 7 -0.034 8 0.047 9 -0.038 10 -0. 122 11 -0.002 Drift 0.0039 0.0518 -0.082 0.099 0.042 -0.011 -0.147 -0.111 0.031 -0.341 0.062 0.045 0.062 0.031 0.008 -0.005 0.008 0.010 -0.132 -0.031 KL US E M E AFE 1( 40:20:40) Drift 0.40 0.20 0.40 0.409874 0.183665 0.417976 0.01145 MRB 0.42952710.201899 0.444062 0.06132 Mean 0.0054 0.453632 0.210476 0.457626 0.04210 Volatility 0. 0506 0.458392 0.20817 0.461338 0.00548 0.442845 0.177489 0.459198 -0.04383 M RB:monthly rebalance 0.463606 0.15782 0.462763 0.00431 0.445939 0.162746 0.467533 -0.00738 0.391364 0.107204 0.405813 -0. 17396 0.390467 0.113798 0.393286 -0.00758 0.0115 0.0640 0.0432 0.0053 -0.0449 -0.0003 -0.0049 -0. 1700 -0.0010 J4 - X fx ELN((G4+H4+14)/(G3+H3+13)) E B US C D EMEAFE P1 (40:20:40) M RB 3 4 5 6 7 8 0.025 0.048 0.056 0.010 -0.034 047 -0.082 0.099 0.042 -0.011 -0. 147 - 111 0.045 0.062 0.031 0.008 -0.005 ning Drift 0.0039 0.0518 G H I J K L US EM E AFE 1( 40:20:40) Drift 0.40 0.20 0.40 0.409874 0.183665 0. 417976 0.01145 MRB 0.429527 0.201899 0.444062 0.06132 Mean 0.0054 0.453632 0.210476 0.457626 0.04210 Volatility 0.0506 0.458392 0.20817 0.461338 0.00548 0.442845 0.177489 0.459198 -0.04383 M RB: monthly rebalance n 162606 n 15782 0462762 00421 0.0115 0.0640 0.0432 0.0053 -0.0449 -n nonStep by Step Solution
There are 3 Steps involved in it
Step: 1

Get Instant Access to Expert-Tailored Solutions
See step-by-step solutions with expert insights and AI powered tools for academic success
Step: 2

Step: 3

Ace Your Homework with AI
Get the answers you need in no time with our AI-driven, step-by-step assistance
Get Started


