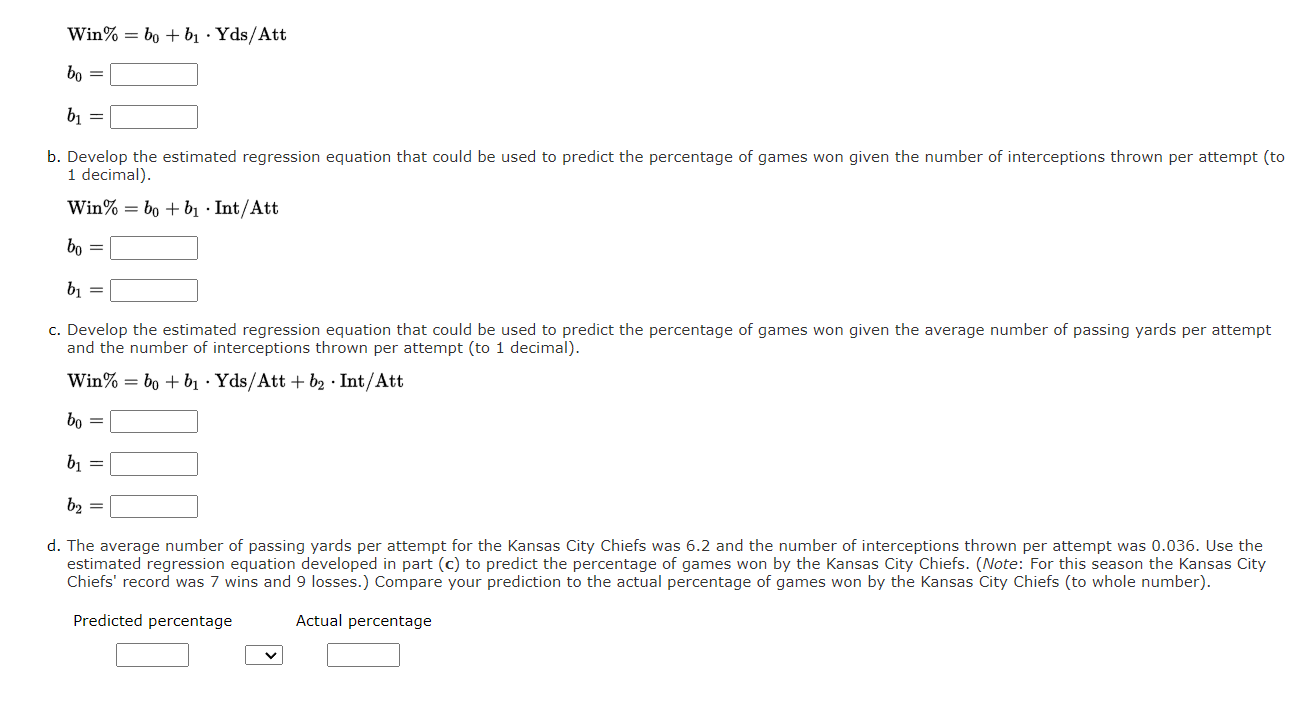
Will% = bl] +b1 'YdS/Att E'0=|:l 51:: . Develop the estimated regression equation that could be used to predict the percentage of games won given
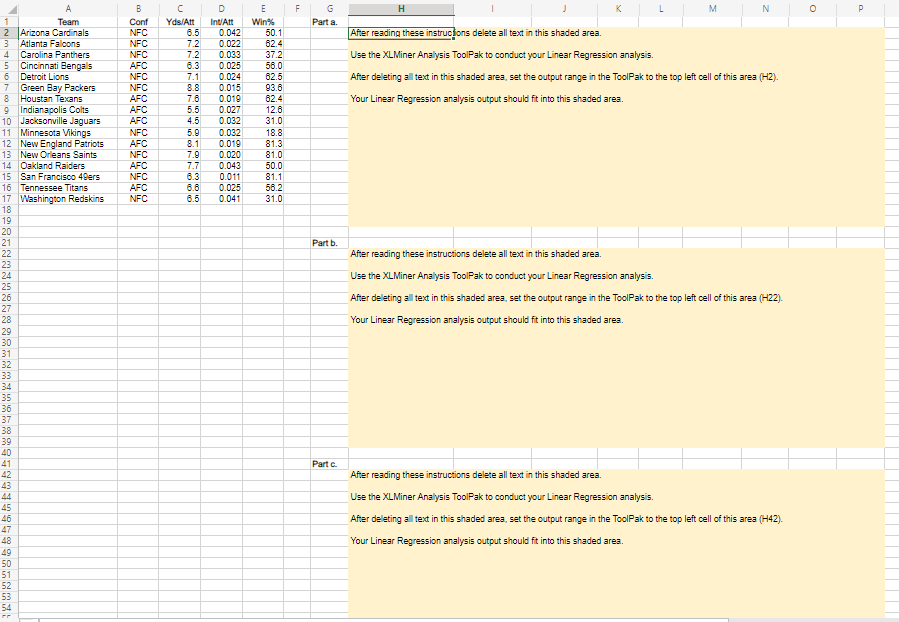
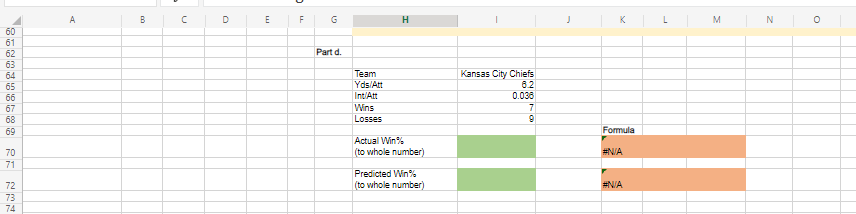
Will% = bl] +b1 'YdS/Att E'0=|:l 51:: . Develop the estimated regression equation that could be used to predict the percentage of games won given the number of interceptions thrown per attempt (to 1 decimal). Win%=b+b1-Int/Att 50:: w: . Develop the estimated regression equation that could be used to predict the percentage of games won given the average number of passing yards per attempt and the number of interceptions thrown per attempt (to 1 decimal). Win% = b0 +131 .Yds/Att+ b2 -Int/Att bo=|:| 51:: 52:: . The average number of passing yards per attempt for the Kansas City Chiefs was 6.2 and the number of interceptions thrown per attempt was 0.036. Use the estimated regression equation developed in part (c) to predict the percentage of games won by the Kansas City Chiefs. (Note: For this season the Kansas City Chiefs' record was 7 wins and 9 losses.) Compare your prediction to the actual percentage of games won by the Kansas City Chiefs (to whole number). Predicted percentage Actual percentage |:|-: D E F K M N 0 P A B C H Team Cont Yds Att Inv/Att Win's Part a. Arizona Cardinals NFC 6.5 0.042 50.1 After reading these instructions delete all text in this shaded area. Atlanta Falcons NFC 7.2 0.022 62.4 Carolina Panthers NFC 7.2 0.033 37.2 Use the XLMiner Analysis ToolPak to conduct your Linear Regression analysis. Cincinnati Bengals AFC 6.3 0.025 56.0 After deleting all text in this shaded area, set the output range in the ToolPak to the top left cell of this ares (H2). Detroit Lions NFC 7.1 0.024 62.5 Green Bay Packers NFC 8.8 0.015 93.6 Houston Texans AFC 7.6 0.019 82.4 Your Linear Regression analysis output should fit into this shaded area. Indianapolis Colts AFC 5.5 0.027 12.6 10 Jacksonville Jaguars AFC 4.5 0.032 31.0 Minnesota Vikings NFC 5.9 0.032 18.8 12 New England Patriots AFC 8.1 0.019 81.3 New Orleans Saints NFC 7.9 0.020 81.0 Oakland Raiders AFC 7.7 0.043 50.0 San Francisco 40ers NFC 6.3 0.011 81.1 16 Tennessee Titans AFC 6.6 0.025 56.2 17 Washington Redskins NEC 6.5 0.041 31.0 18 19 20 Part b. After reading these instructions delete all text in this shaded area. Use the XLMiner Analysis ToolPak to conduct your Linear Regression analysis. After deleting all text in this shaded area, set the output range in the ToolPak to the top left cell of this ares (H22). Your Linear Regression analysis output should fit into this shaded area. Part c. After reading these instructions delete all text in this shaded area. Use the XLMiner Analysis ToolPak to conduct your Linear Regression analysis. After deleting all text in this shaded ares, set the output range in the ToolPak to the top left cell of this ares (H42). Your Linear Regression analysis output should fit into this shaded area.A C D E TI G H K L M N 60 62 Part d. 64 Team Kansas City Chiefs Yds/Att 82 66 Int'Att 0.038 Wins 19 68 Losses 69 Formula Actual Win 70 (to whole number) #N/A 71 Predicted Win% 72 (to whole number) #NIA 73 74
Step by Step Solution
There are 3 Steps involved in it
Step: 1
Get Instant Access to Expert-Tailored Solutions
See step-by-step solutions with expert insights and AI powered tools for academic success
Step: 2
Step: 3
Ace Your Homework with AI
Get the answers you need in no time with our AI-driven, step-by-step assistance