

Answered step by step
Verified Expert Solution
Question
1 Approved Answer
will thumbs up Harmon Foods, Inc. John MacIntyre, general sales manager of the Breakfast Foods Division of Harmon Foods, Inc., was having difficulty in forecasting

will thumbs up
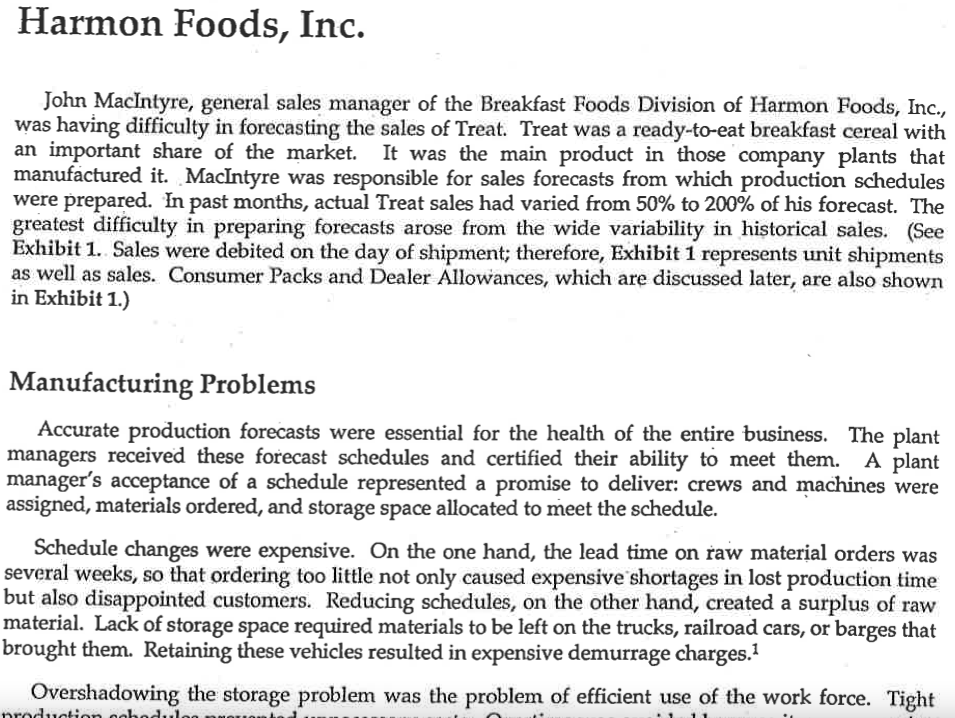
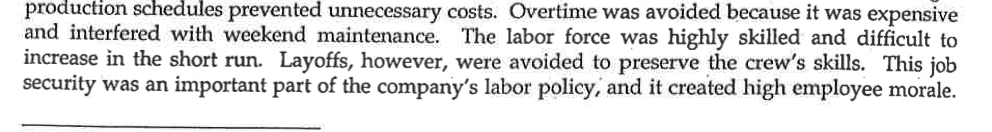
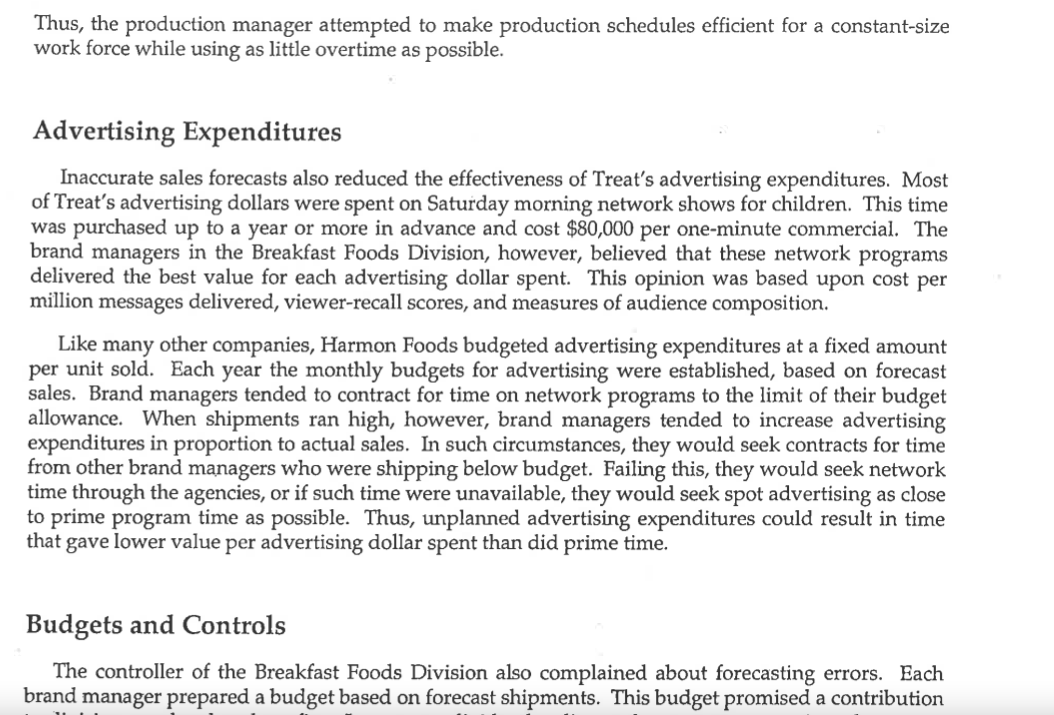
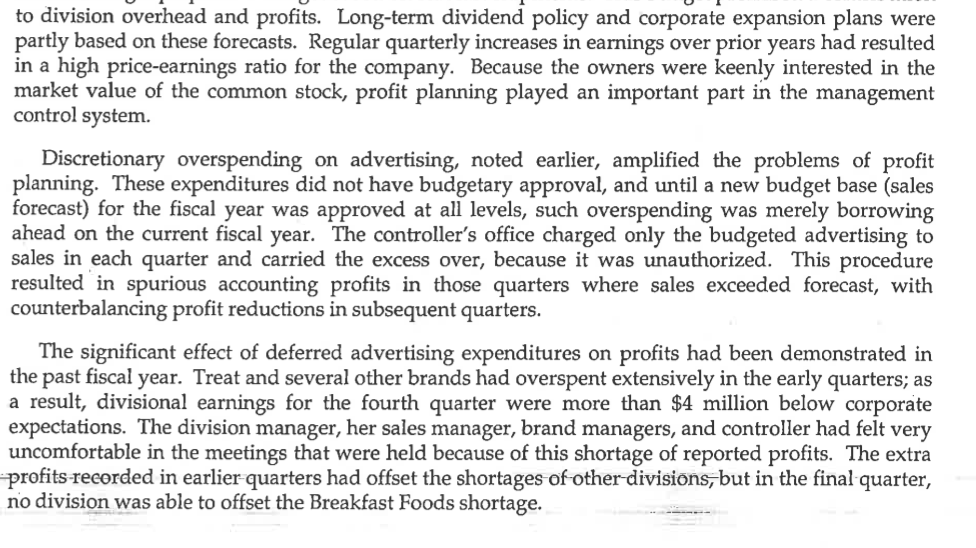
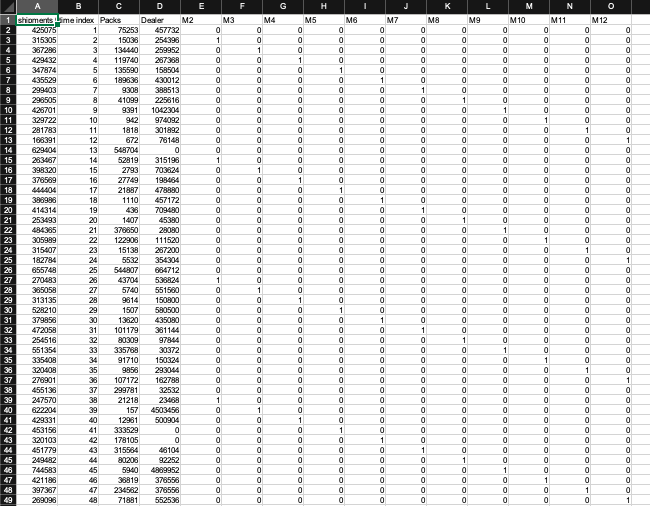
Harmon Foods, Inc. John MacIntyre, general sales manager of the Breakfast Foods Division of Harmon Foods, Inc., was having difficulty in forecasting the sales of Treat. Treat was a ready-to-eat breakfast cereal with an important share of the market. It was the main product in those company plants that manufactured it. MacIntyre was responsible for sales forecasts from which production schedules were prepared. n past months, actual Treat sales had varied from 50% to 200% of his forecast. The greatest difficulty in preparing forecasts arose from the wide variability in historical sales. (See Exhibit 1. Sales were debited on the day of shipment; therefore, Exhibit 1 represents unit shipments as well as sales. Consumer Packs and Dealer Allowances, which are discussed later, are also shown in Exhibit 1.) Manufacturing Problems Accurate production forecasts were essential for the health of the entire business. The plant managers received these forecast schedules and certified their ability to meet them. A plant manager's acceptance of a schedule represented a promise to deliver: crews and machines were assigned, materials ordered, and storage space allocated to meet the schedule. Schedule changes were expensive. On the one hand, the lead time on raw material orders was several weeks, so that ordering too little not only caused expensive shortages in lost production time but also disappointed customers. Reducing schedules, on the other hand, created a surplus of raw material. Lack of storage space required materials to be left on the trucks, railroad cars, or barges that brought them. Retaining these vehicles resulted in expensive demurrage charges.1 Overshadowing the storage problem was the problem of efficient use of the work force. Tight production cohodi production schedules prevented unnecessary costs. Overtime was avoided because it was expensive and interfered with weekend maintenance. The labor force was highly skilled and difficult to increase in the short run. Layoffs, however, were avoided to preserve the crew's skills. This job security was an important part of the company's labor policy, and it created high employee morale. Thus, the production manager attempted to make production schedules efficient for a constant-size work force while using as little overtime as possible. Advertising Expenditures Inaccurate sales forecasts also reduced the effectiveness of Treat's advertising expenditures. Most of Treat's advertising dollars were spent on Saturday morning network shows for children. This time was purchased up to a year or more in advance and cost $80,000 per one-minute commercial. The brand managers in the Breakfast Foods Division, however, believed that these network programs delivered the best value for each advertising dollar spent. This opinion was based upon cost per million messages delivered, viewer-recall scores, and measures of audience composition. Like many other companies, Harmon Foods budgeted advertising expenditures at a fixed amount per unit sold. Each year the monthly budgets for advertising were established, based on forecast sales. Brand managers tended to contract for time on network programs to the limit of their budget allowance. When shipments ran high, however, brand managers tended to increase advertising expenditures in proportion to actual sales. In such circumstances, they would seek contracts for time from other brand managers who were shipping below budget. Failing this, they would seek network time through the agencies, or if such time were unavailable, they would seek spot advertising as close to prime program time as possible. Thus, unplanned advertising expenditures could result in time that gave lower value per advertising dollar spent than did prime time. Budgets and Controls The controller of the Breakfast Foods Division also complained about forecasting errors. Each brand manager prepared a budget based on forecast shipments. This budget promised a contribution to division overhead and profits. Long-term dividend policy and corporate expansion plans were partly based on these forecasts. Regular quarterly increases in earnings over prior years had resulted in a high price-earnings ratio for the company. Because the owners were keenly interested in the market value of the common stock, profit planning played an important part in the management control system. Discretionary overspending on advertising, noted earlier, amplified the problems of profit planning. These expenditures did not have budgetary approval, and until a new budget base (sales forecast) for the fiscal year was approved at all levels, such overspending was merely borrowing ahead on the current fiscal year. The controller's office charged only the budgeted advertising to sales in each quarter and carried the excess over, because it was unauthorized. This procedure resulted in spurious accounting profits in those quarters where sales exceeded forecast, with counterbalancing profit reductions in subsequent quarters. The significant effect of deferred advertising expenditures on profits had been demonstrated in the past fiscal year. Treat and several other brands had overspent extensively in the early quarters; as a result, divisional earnings for the fourth quarter were more than $4 million below corporate expectations. The division manager, her sales manager, brand managers, and controller had felt very uncomfortable in the meetings that were held because of this shortage of reported profits. The extra profits recorded in earlier quarters had offset the shortages of other divisions, but in the final quarter, no division was able to offset the Breakfast Foods shortage. The Brand Manager Donald Carswell, the brand manager for Treat, prepared his brand's budget based on a set of monthly, quarterly, and annual forecasts that governed monthly advertising and promotional expenditures. These forecasts, along with forecasts from the division's other brand managers, were submitted to MacIntyre for approval. This approval was necessary because, in a given month, the salesforce could only support the promotions of a limited number of brands. Once approved, the brand managers' forecasts were the basis for MacIntyre's official forecasts. The production schedule, in turn, was based upon MacIntyre's official forecast. This required mutual confidence and understanding. Macintyre provided information on Harmon's and also competitors' activities and pricings at the stores. The brand managers furnished knowledge of market trends for their brands and their brands' competitors. The brand managers also kept records of all available market research reports on their brands and similar brands and were aware of any package design and product formulations under development. As Treat's brand manager, Carswell knew that it was his responsibility to improve the reliability of sales forecasts for Treat. After talking to analysts in the Market Research, Systems Analysis, and Operations Research departments, he concluded that better forecasts were possible. Robert Haas of the Operations Research Department offered to work with him on the project. MacIntyre and the controller enthusiastically supported Carswell's undertaking. Although such projects were outside the normal scope of a brand manager's duties, Carswell recognized this as an opportunity to find a solution to his forecasting problem that would have companywide application. Factors Affecting Sales Carswell and Haas delved into the factors that influenced sales. A 12-month moving average of the data in Exhibit 1 indicated a long-term rising trend in sales. This trend confirmed the A.C. Nielsen store audit, which reported a small but steady rise in market share for Treat and a steady rise for the commodity group to which Treat belonged. Besides trend, Carswell felt that seasonal factors might be important. In November and December, sales slowed down as inventory levels among stores and jobbers were drawn down for year-end inventories. Summer sales were often low because of plant shutdowns and sales personnel vacations. There were fewer selling days in February. Salespeople often began the fiscal year with a burst of energy, jockeying for a strong quota position for the rest of the year. Carswell obtained data made available by the National Association of Cereal Manufacturers, showing seasonal effects on shipments of breakfast cereals in the United States. These indexes appear in Exhibit 2. Nonmedia promotions, which represented about 25% of Treat's advertising budget, strongly influenced sales. The two main types of promotions were consumer packs and dealer allowances. Promotions targeted directly at the consumer were called consumer packs, so named because the consumer was reimbursed in some way for each package of Treat that was purchased. Promotions that sought to increase sales by encouraging the dealer to push the brand were called dealer allowances, so called because allowances were made to dealers to compensate them for expenditures incurred in promoting Treat. Consumer packs and dealer allowances were each offered two or three times a year during different_canvass periods... (A sales canvass period is the time required-for-a salesperson to make a complete round to all customers in the assigned area. Harmon Foods scheduled 10 five-week canvass periods each year. The remaining two weeks--one at mid-summer and one at year-end-were for holidays and vacations.) Consumer Packs Consumer packs were usually a 20-cent-per-package reduction in the price the consumer paid. The promotion could also be made as a coupon, an enclosed premium, or a mail-in offer. Based on the results of consumer-panel tests of all such promotions, however, Carswell was confident that these forms were roughly equivalent to the 20-cent price reduction in its return to the brand. Consequently, he decided not to make a distinction among the different kinds of consumer packs. (Exhibit 1 shows the history of consumer pack shipments.) Consumer packs, supporting advertising material, and special cartons were produced before the assigned canvass period for shipment throughout the five-week period. Any packs not shipped within this period would be allocated among the salespeople for shipment in periods in which no consumer promotion was officially scheduled. From a study of historical data that covered several consumer packs, Haas found that approximately 35% of a consumer-pack offering moved out during the first week, 25% during the second week, 15% during the third week, and approximately 10% during each of the fourth and fifth weeks of the canvass period. Approximately 5% was shipped after the promotional period. Because they saw no reason for this historical pattern to change, Haas and Carswell were confident that they could predict with reasonable accuracy future monthly consumer pack shipments. Total shipments were favorably affected, of course, during the month in which the consumer packs were shipped. Because the consumer ate Treat at a more or less constant rate over time, Carswell was convinced that part of the increase in total shipments resulted from inventory build-ups by jobbers, stores, and consumers. Thus, he thought that the consumer packs might have a negative influence on total shipments in subsequent months as these excess inventories were depleted in the first, or possibly the second, month after the packs were shipped. Dealer Allowances Sales seemed even more sensitive to allowances offered to dealers for cooperative promotional efforts. Participating dealers received a $4 to $8 per-case discount on their purchases during the allowance's canvass period. The total expenditure for dealer allowances during a given promotional canvass period was budgeted in advance. As with consumer packs, any unspent allowances would be allocated to the salespeople for disbursement after the promotional period. The actual weekly expenditures resulting from these allowances followed approximately the same pattern as the one for the shipment of consumer packs. Consequently, Carswell believed that the monthly expenditures resulting from any given schedule of future dealer allowances could also be predicted with reasonable accuracy. Dealers promoted Treat by using giant, spectacular end-of-aisle displays, newspaper ads, coupons, fliers, and so forth. Such efforts could affect sales dramatically. For example, an end-of- aisle display located near a cash register could do an average of five weeks' business in a single weekend. As with consumer packs, however, Carswell believed that much of the sales increase was attributable to inventory build-ups, and therefore he expected reactions to these build-ups as late as two months after the initial sales increase. Actual expenditures made for dealer allowances from 1983 to 1987 appear in Exhibit 1. E H K L N 18 F M3 0 1 0 0 M12 0 0 M5 0 0 0 1 0 0 0 0 0 M9 0 0 0 0 0 0 0 0 0 0 0 0 0 0 0 0 0 0 0 1 0 0 0 0 1 M11 0 0 0 0 0 0 0 0 0 1 0 0 0 0 0 0 0 0 0 1 0 0 0 0 0 0 0 0 0 0 0 0 0 0 0 0 0 1 0 0 0 0 0 0 0 1 0 0 0 0 0 0 0 0 0 0 0 0 0 0 0 0 0 0 0 0 0 0 1 0 0 0 0 0 0 0 0 0 0 0 0 0 0 0 0 0 0 0 0 0 0 1 0 0 G M4 0 0 1 0 0 0 0 0 0 0 0 0 0 0 1 0 0 0 0 0 0 0 0 0 0 0 1 0 0 0 0 0 0 0 0 0 0 0 1 0 0 0 1 0 1 0 0 0 0 0 0 0 0 0 0 C D shipments Lime index Packs Dealer M2 2 425075 1 75253 457732 3 315305 2 15038 254398 387286 3 134440 259952 5 429432 4 119740 267368 6 347874 5 135590 158504 7 435529 6 189638 430012 8 299403 7 9308 388513 9 298505 8 41099 225616 10 426701 9 9391 1042304 11 329722 10 942 974092 12 281783 11 1818 301892 13 168391 12 672 78148 14 629404 13 548704 0 15 283467 52819 315198 16 398320 15 2793 703824 17 378569 16 27749 198484 18 21887 478880 19 388988 18 1110 457172 20 414314 19 709480 21 253493 20 1407 45380 22 484385 21 378850 28080 23 305989 22 122908 111520 24 315407 23 15138 267200 25 182784 24 5532 354304 28 655748 25 544807 684712 27 270483 26 43704 538824 28 385058 27 5740 551580 29 313135 28 9814 150800 30 528210 29 1507 580500 31 379956 30 13820 435080 32 472058 31 101179 381144 33 254516 32 80309 97844 34 551354 33 335788 30372 35 335408 91710 150324 38 320408 35 9856 293044 37 278901 38 107172 162788 38 455138 37 299781 32532 39 247570 38 21218 23488 622204 39 157 4503456 41 429331 40 12981 500904 453156 41 333529 0 320103 178105 0 451779 315564 48104 45 249482 80208 92252 744583 45 5940 4989952 421186 38819 376556 48 397387 47 234562 378556 289098 71881 552538 0 0 0 0 0 0 0 1 0 0 0 0 0 1 0 0 0 0 0 0 0 0 M7 0 0 0 0 0 1 0 0 0 0 0 0 0 0 0 0 0 1 0 0 0 0 0 0 0 0 0 0 0 1 0 0 0 0 0 0 0 0 0 0 0 1 0 0 0 0 0 0 0 M M10 0 0 0 0 0 0 0 0 1 0 0 0 0 0 0 0 0 0 0 0 1 0 0 0 0 0 0 0 0 0 0 0 1 0 0 0 0 0 0 0 0 0 0 0 1 0 0 0 0 0 0 0 0 0 1 0 0 0 0 0 0 0 0 0 0 0 0 1 0 0 0 0 0 0 0 0 0 0 0 0 0 1 0 0 0 0 0 0 0 0 0 0 0 0 0 0 0 0 0 0 0 1 0 1 0 0 0 0 0 0 0 0 0 0 0 0 0 0 1 0 0 0 0 0 0 0 0 0 0 0 0 0 1 0 0 0 0 0 0 0 0 0 0 0 0 0 0 0 0 0 0 0 0 1 0 0 0 0 0 0 0 0 0 0 0 1 0 0 0 0 0 1 0 0 0 0 0 0 0 0 0 0 0 0 0 0 0 0 0 0 0 0 0 1 0 0 0 0 0 0 0 0 0 0 1 0 1 0 0 0 0 0 0 0 0 0 0 0 0 0 0 0 0 0 0 0 1 0 0 0 0 0 0 0 0 0 0 0 0 0 0 0 1 0 0 0 0 1 0 0 0 0 0 0 0 0 1 0 0 0 0 0 0 0 1 0 0 0 HARMON FOODS INC., CASE STUDY From management point of view what model do you think makes most sense for predicting monthly shipments of Treat cereal? After testing those models that you think make most sense for forecasting in this situation select the model that you think is best and use it to project shipments for January 1988. What do you need to know in order to use this model to prepare this forecast? What can you learn from an examination of the coefficients in your model as to the relative impact of consumer promotions versus dealer promotions? What impro ents, if any, would you recommend to the product manager in terms of the timing and amounts of dealer promotions and consumer promotions in the future? Harmon Foods, Inc. John MacIntyre, general sales manager of the Breakfast Foods Division of Harmon Foods, Inc., was having difficulty in forecasting the sales of Treat. Treat was a ready-to-eat breakfast cereal with an important share of the market. It was the main product in those company plants that manufactured it. MacIntyre was responsible for sales forecasts from which production schedules were prepared. n past months, actual Treat sales had varied from 50% to 200% of his forecast. The greatest difficulty in preparing forecasts arose from the wide variability in historical sales. (See Exhibit 1. Sales were debited on the day of shipment; therefore, Exhibit 1 represents unit shipments as well as sales. Consumer Packs and Dealer Allowances, which are discussed later, are also shown in Exhibit 1.) Manufacturing Problems Accurate production forecasts were essential for the health of the entire business. The plant managers received these forecast schedules and certified their ability to meet them. A plant manager's acceptance of a schedule represented a promise to deliver: crews and machines were assigned, materials ordered, and storage space allocated to meet the schedule. Schedule changes were expensive. On the one hand, the lead time on raw material orders was several weeks, so that ordering too little not only caused expensive shortages in lost production time but also disappointed customers. Reducing schedules, on the other hand, created a surplus of raw material. Lack of storage space required materials to be left on the trucks, railroad cars, or barges that brought them. Retaining these vehicles resulted in expensive demurrage charges.1 Overshadowing the storage problem was the problem of efficient use of the work force. Tight production cohodi production schedules prevented unnecessary costs. Overtime was avoided because it was expensive and interfered with weekend maintenance. The labor force was highly skilled and difficult to increase in the short run. Layoffs, however, were avoided to preserve the crew's skills. This job security was an important part of the company's labor policy, and it created high employee morale. Thus, the production manager attempted to make production schedules efficient for a constant-size work force while using as little overtime as possible. Advertising Expenditures Inaccurate sales forecasts also reduced the effectiveness of Treat's advertising expenditures. Most of Treat's advertising dollars were spent on Saturday morning network shows for children. This time was purchased up to a year or more in advance and cost $80,000 per one-minute commercial. The brand managers in the Breakfast Foods Division, however, believed that these network programs delivered the best value for each advertising dollar spent. This opinion was based upon cost per million messages delivered, viewer-recall scores, and measures of audience composition. Like many other companies, Harmon Foods budgeted advertising expenditures at a fixed amount per unit sold. Each year the monthly budgets for advertising were established, based on forecast sales. Brand managers tended to contract for time on network programs to the limit of their budget allowance. When shipments ran high, however, brand managers tended to increase advertising expenditures in proportion to actual sales. In such circumstances, they would seek contracts for time from other brand managers who were shipping below budget. Failing this, they would seek network time through the agencies, or if such time were unavailable, they would seek spot advertising as close to prime program time as possible. Thus, unplanned advertising expenditures could result in time that gave lower value per advertising dollar spent than did prime time. Budgets and Controls The controller of the Breakfast Foods Division also complained about forecasting errors. Each brand manager prepared a budget based on forecast shipments. This budget promised a contribution to division overhead and profits. Long-term dividend policy and corporate expansion plans were partly based on these forecasts. Regular quarterly increases in earnings over prior years had resulted in a high price-earnings ratio for the company. Because the owners were keenly interested in the market value of the common stock, profit planning played an important part in the management control system. Discretionary overspending on advertising, noted earlier, amplified the problems of profit planning. These expenditures did not have budgetary approval, and until a new budget base (sales forecast) for the fiscal year was approved at all levels, such overspending was merely borrowing ahead on the current fiscal year. The controller's office charged only the budgeted advertising to sales in each quarter and carried the excess over, because it was unauthorized. This procedure resulted in spurious accounting profits in those quarters where sales exceeded forecast, with counterbalancing profit reductions in subsequent quarters. The significant effect of deferred advertising expenditures on profits had been demonstrated in the past fiscal year. Treat and several other brands had overspent extensively in the early quarters; as a result, divisional earnings for the fourth quarter were more than $4 million below corporate expectations. The division manager, her sales manager, brand managers, and controller had felt very uncomfortable in the meetings that were held because of this shortage of reported profits. The extra profits recorded in earlier quarters had offset the shortages of other divisions, but in the final quarter, no division was able to offset the Breakfast Foods shortage. The Brand Manager Donald Carswell, the brand manager for Treat, prepared his brand's budget based on a set of monthly, quarterly, and annual forecasts that governed monthly advertising and promotional expenditures. These forecasts, along with forecasts from the division's other brand managers, were submitted to MacIntyre for approval. This approval was necessary because, in a given month, the salesforce could only support the promotions of a limited number of brands. Once approved, the brand managers' forecasts were the basis for MacIntyre's official forecasts. The production schedule, in turn, was based upon MacIntyre's official forecast. This required mutual confidence and understanding. Macintyre provided information on Harmon's and also competitors' activities and pricings at the stores. The brand managers furnished knowledge of market trends for their brands and their brands' competitors. The brand managers also kept records of all available market research reports on their brands and similar brands and were aware of any package design and product formulations under development. As Treat's brand manager, Carswell knew that it was his responsibility to improve the reliability of sales forecasts for Treat. After talking to analysts in the Market Research, Systems Analysis, and Operations Research departments, he concluded that better forecasts were possible. Robert Haas of the Operations Research Department offered to work with him on the project. MacIntyre and the controller enthusiastically supported Carswell's undertaking. Although such projects were outside the normal scope of a brand manager's duties, Carswell recognized this as an opportunity to find a solution to his forecasting problem that would have companywide application. Factors Affecting Sales Carswell and Haas delved into the factors that influenced sales. A 12-month moving average of the data in Exhibit 1 indicated a long-term rising trend in sales. This trend confirmed the A.C. Nielsen store audit, which reported a small but steady rise in market share for Treat and a steady rise for the commodity group to which Treat belonged. Besides trend, Carswell felt that seasonal factors might be important. In November and December, sales slowed down as inventory levels among stores and jobbers were drawn down for year-end inventories. Summer sales were often low because of plant shutdowns and sales personnel vacations. There were fewer selling days in February. Salespeople often began the fiscal year with a burst of energy, jockeying for a strong quota position for the rest of the year. Carswell obtained data made available by the National Association of Cereal Manufacturers, showing seasonal effects on shipments of breakfast cereals in the United States. These indexes appear in Exhibit 2. Nonmedia promotions, which represented about 25% of Treat's advertising budget, strongly influenced sales. The two main types of promotions were consumer packs and dealer allowances. Promotions targeted directly at the consumer were called consumer packs, so named because the consumer was reimbursed in some way for each package of Treat that was purchased. Promotions that sought to increase sales by encouraging the dealer to push the brand were called dealer allowances, so called because allowances were made to dealers to compensate them for expenditures incurred in promoting Treat. Consumer packs and dealer allowances were each offered two or three times a year during different_canvass periods... (A sales canvass period is the time required-for-a salesperson to make a complete round to all customers in the assigned area. Harmon Foods scheduled 10 five-week canvass periods each year. The remaining two weeks--one at mid-summer and one at year-end-were for holidays and vacations.) Consumer Packs Consumer packs were usually a 20-cent-per-package reduction in the price the consumer paid. The promotion could also be made as a coupon, an enclosed premium, or a mail-in offer. Based on the results of consumer-panel tests of all such promotions, however, Carswell was confident that these forms were roughly equivalent to the 20-cent price reduction in its return to the brand. Consequently, he decided not to make a distinction among the different kinds of consumer packs. (Exhibit 1 shows the history of consumer pack shipments.) Consumer packs, supporting advertising material, and special cartons were produced before the assigned canvass period for shipment throughout the five-week period. Any packs not shipped within this period would be allocated among the salespeople for shipment in periods in which no consumer promotion was officially scheduled. From a study of historical data that covered several consumer packs, Haas found that approximately 35% of a consumer-pack offering moved out during the first week, 25% during the second week, 15% during the third week, and approximately 10% during each of the fourth and fifth weeks of the canvass period. Approximately 5% was shipped after the promotional period. Because they saw no reason for this historical pattern to change, Haas and Carswell were confident that they could predict with reasonable accuracy future monthly consumer pack shipments. Total shipments were favorably affected, of course, during the month in which the consumer packs were shipped. Because the consumer ate Treat at a more or less constant rate over time, Carswell was convinced that part of the increase in total shipments resulted from inventory build-ups by jobbers, stores, and consumers. Thus, he thought that the consumer packs might have a negative influence on total shipments in subsequent months as these excess inventories were depleted in the first, or possibly the second, month after the packs were shipped. Dealer Allowances Sales seemed even more sensitive to allowances offered to dealers for cooperative promotional efforts. Participating dealers received a $4 to $8 per-case discount on their purchases during the allowance's canvass period. The total expenditure for dealer allowances during a given promotional canvass period was budgeted in advance. As with consumer packs, any unspent allowances would be allocated to the salespeople for disbursement after the promotional period. The actual weekly expenditures resulting from these allowances followed approximately the same pattern as the one for the shipment of consumer packs. Consequently, Carswell believed that the monthly expenditures resulting from any given schedule of future dealer allowances could also be predicted with reasonable accuracy. Dealers promoted Treat by using giant, spectacular end-of-aisle displays, newspaper ads, coupons, fliers, and so forth. Such efforts could affect sales dramatically. For example, an end-of- aisle display located near a cash register could do an average of five weeks' business in a single weekend. As with consumer packs, however, Carswell believed that much of the sales increase was attributable to inventory build-ups, and therefore he expected reactions to these build-ups as late as two months after the initial sales increase. Actual expenditures made for dealer allowances from 1983 to 1987 appear in Exhibit 1. E H K L N 18 F M3 0 1 0 0 M12 0 0 M5 0 0 0 1 0 0 0 0 0 M9 0 0 0 0 0 0 0 0 0 0 0 0 0 0 0 0 0 0 0 1 0 0 0 0 1 M11 0 0 0 0 0 0 0 0 0 1 0 0 0 0 0 0 0 0 0 1 0 0 0 0 0 0 0 0 0 0 0 0 0 0 0 0 0 1 0 0 0 0 0 0 0 1 0 0 0 0 0 0 0 0 0 0 0 0 0 0 0 0 0 0 0 0 0 0 1 0 0 0 0 0 0 0 0 0 0 0 0 0 0 0 0 0 0 0 0 0 0 1 0 0 G M4 0 0 1 0 0 0 0 0 0 0 0 0 0 0 1 0 0 0 0 0 0 0 0 0 0 0 1 0 0 0 0 0 0 0 0 0 0 0 1 0 0 0 1 0 1 0 0 0 0 0 0 0 0 0 0 C D shipments Lime index Packs Dealer M2 2 425075 1 75253 457732 3 315305 2 15038 254398 387286 3 134440 259952 5 429432 4 119740 267368 6 347874 5 135590 158504 7 435529 6 189638 430012 8 299403 7 9308 388513 9 298505 8 41099 225616 10 426701 9 9391 1042304 11 329722 10 942 974092 12 281783 11 1818 301892 13 168391 12 672 78148 14 629404 13 548704 0 15 283467 52819 315198 16 398320 15 2793 703824 17 378569 16 27749 198484 18 21887 478880 19 388988 18 1110 457172 20 414314 19 709480 21 253493 20 1407 45380 22 484385 21 378850 28080 23 305989 22 122908 111520 24 315407 23 15138 267200 25 182784 24 5532 354304 28 655748 25 544807 684712 27 270483 26 43704 538824 28 385058 27 5740 551580 29 313135 28 9814 150800 30 528210 29 1507 580500 31 379956 30 13820 435080 32 472058 31 101179 381144 33 254516 32 80309 97844 34 551354 33 335788 30372 35 335408 91710 150324 38 320408 35 9856 293044 37 278901 38 107172 162788 38 455138 37 299781 32532 39 247570 38 21218 23488 622204 39 157 4503456 41 429331 40 12981 500904 453156 41 333529 0 320103 178105 0 451779 315564 48104 45 249482 80208 92252 744583 45 5940 4989952 421186 38819 376556 48 397387 47 234562 378556 289098 71881 552538 0 0 0 0 0 0 0 1 0 0 0 0 0 1 0 0 0 0 0 0 0 0 M7 0 0 0 0 0 1 0 0 0 0 0 0 0 0 0 0 0 1 0 0 0 0 0 0 0 0 0 0 0 1 0 0 0 0 0 0 0 0 0 0 0 1 0 0 0 0 0 0 0 M M10 0 0 0 0 0 0 0 0 1 0 0 0 0 0 0 0 0 0 0 0 1 0 0 0 0 0 0 0 0 0 0 0 1 0 0 0 0 0 0 0 0 0 0 0 1 0 0 0 0 0 0 0 0 0 1 0 0 0 0 0 0 0 0 0 0 0 0 1 0 0 0 0 0 0 0 0 0 0 0 0 0 1 0 0 0 0 0 0 0 0 0 0 0 0 0 0 0 0 0 0 0 1 0 1 0 0 0 0 0 0 0 0 0 0 0 0 0 0 1 0 0 0 0 0 0 0 0 0 0 0 0 0 1 0 0 0 0 0 0 0 0 0 0 0 0 0 0 0 0 0 0 0 0 1 0 0 0 0 0 0 0 0 0 0 0 1 0 0 0 0 0 1 0 0 0 0 0 0 0 0 0 0 0 0 0 0 0 0 0 0 0 0 0 1 0 0 0 0 0 0 0 0 0 0 1 0 1 0 0 0 0 0 0 0 0 0 0 0 0 0 0 0 0 0 0 0 1 0 0 0 0 0 0 0 0 0 0 0 0 0 0 0 1 0 0 0 0 1 0 0 0 0 0 0 0 0 1 0 0 0 0 0 0 0 1 0 0 0 HARMON FOODS INC., CASE STUDY From management point of view what model do you think makes most sense for predicting monthly shipments of Treat cereal? After testing those models that you think make most sense for forecasting in this situation select the model that you think is best and use it to project shipments for January 1988. What do you need to know in order to use this model to prepare this forecast? What can you learn from an examination of the coefficients in your model as to the relative impact of consumer promotions versus dealer promotions? What impro ents, if any, would you recommend to the product manager in terms of the timing and amounts of dealer promotions and consumer promotions in the future Step by Step Solution
There are 3 Steps involved in it
Step: 1

Get Instant Access to Expert-Tailored Solutions
See step-by-step solutions with expert insights and AI powered tools for academic success
Step: 2

Step: 3
Ace Your Homework with AI
Get the answers you need in no time with our AI-driven, step-by-step assistance
Get Started
The Yield Curve And Financial Risk Premia Implications For Monetary Policy
Authors: Felix Geiger
1st Edition
3642215742, 3642215750, 9783642215742, 9783642215759