Answered step by step
Verified Expert Solution
Question
1 Approved Answer
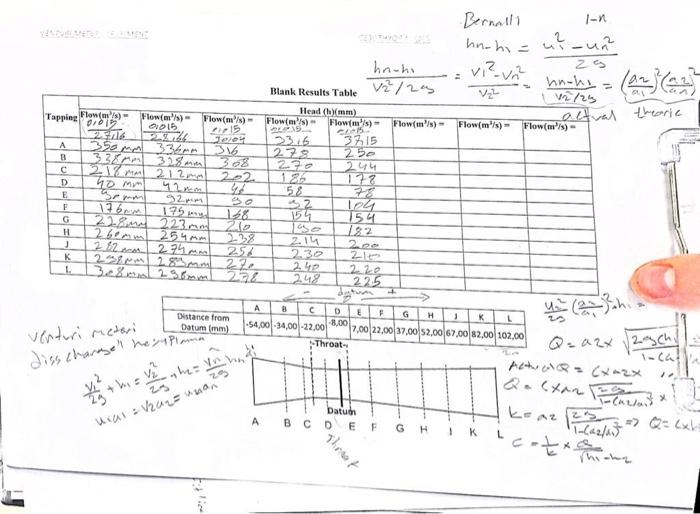
with calculations hh1h1BlankResultsTable=2su2un2v22/2shnh1=v2v12vn2=w1hnh= To compare theoretical and nctual pressure distribution, create a chart of dimensionless pressure (vertical axis) against position along the Venturi (horizontal axis).
with calculations 


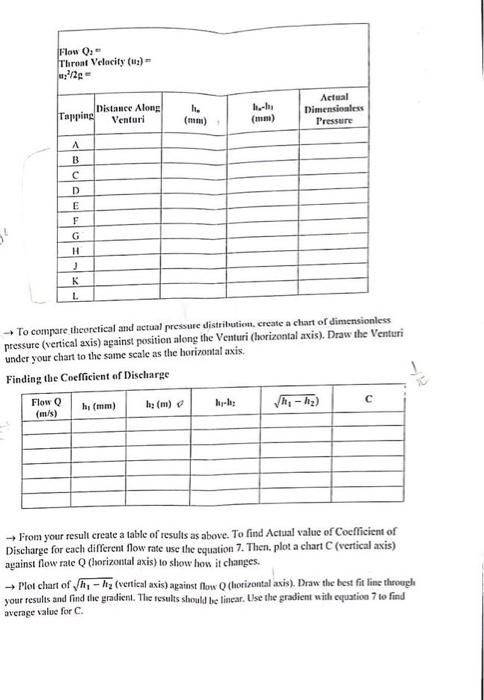
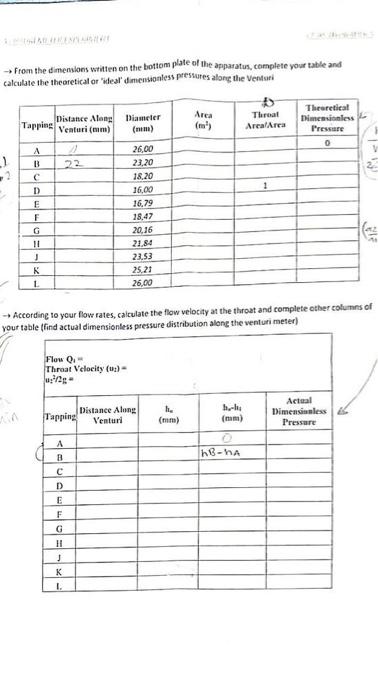
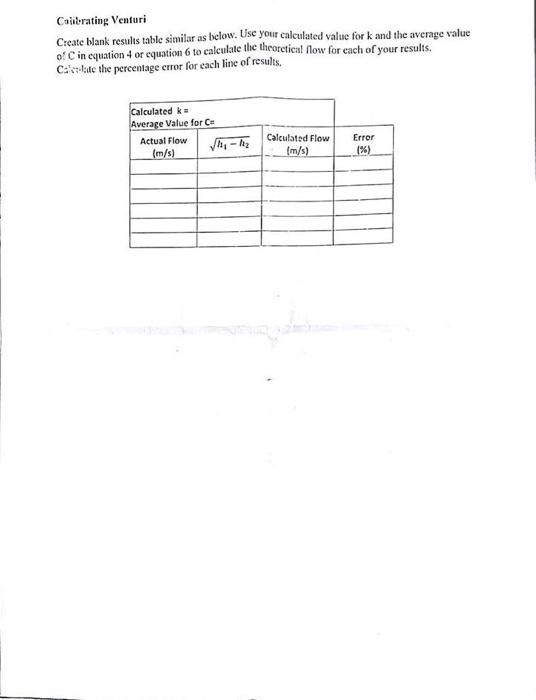
hh1h1BlankResultsTable=2su2un2v22/2shnh1=v2v12vn2=w1hnh= To compare theoretical and nctual pressure distribution, create a chart of dimensionless pressure (vertical axis) against position along the Venturi (horizontal axis). Draw the Venturi under your chant to the same scale as the horizontal axis. Finding the Coefficient of Discharge From your result create a lable of results as above. To find Actual value of Coefficicnt of Discharge for each different flow rate use the equation 7. Then. plot a chart C (vertical axis) against flow rate Q (horizontal axis) to show how it changes. Plot chart of h1h2 (vertical axis) against flow Q (horizontal axis). Draw the best fit fine through your results and find the gradient. The results should be linear. Use the gradient with cquation 7 to find average salue for C. From the dimemions written on the bottom plate of the apparatus, complete your table and calculate the theoretical or "ideal' dimensionless pressures along the Venturi According to your flow rates, caiculate the flow velocity at the throat and complete other columns of your table (find actual dimensiontess pressure distribution alone the venturi meter) Coilerating Venturi Create blank results table similar as below. Use your calculated value for k and the average value o! C in equation 4 or cquation 6 to calculate the theoretical flow for each of your results. Ca'stilite the percentage crror for cach line of results. hh1h1BlankResultsTable=2su2un2v22/2shnh1=v2v12vn2=w1hnh= To compare theoretical and nctual pressure distribution, create a chart of dimensionless pressure (vertical axis) against position along the Venturi (horizontal axis). Draw the Venturi under your chant to the same scale as the horizontal axis. Finding the Coefficient of Discharge From your result create a lable of results as above. To find Actual value of Coefficicnt of Discharge for each different flow rate use the equation 7. Then. plot a chart C (vertical axis) against flow rate Q (horizontal axis) to show how it changes. Plot chart of h1h2 (vertical axis) against flow Q (horizontal axis). Draw the best fit fine through your results and find the gradient. The results should be linear. Use the gradient with cquation 7 to find average salue for C. From the dimemions written on the bottom plate of the apparatus, complete your table and calculate the theoretical or "ideal' dimensionless pressures along the Venturi According to your flow rates, caiculate the flow velocity at the throat and complete other columns of your table (find actual dimensiontess pressure distribution alone the venturi meter) Coilerating Venturi Create blank results table similar as below. Use your calculated value for k and the average value o! C in equation 4 or cquation 6 to calculate the theoretical flow for each of your results. Ca'stilite the percentage crror for cach line of results 


Step by Step Solution
There are 3 Steps involved in it
Step: 1

Get Instant Access to Expert-Tailored Solutions
See step-by-step solutions with expert insights and AI powered tools for academic success
Step: 2

Step: 3

Ace Your Homework with AI
Get the answers you need in no time with our AI-driven, step-by-step assistance
Get Started


