

Answered step by step
Verified Expert Solution
Question
1 Approved Answer
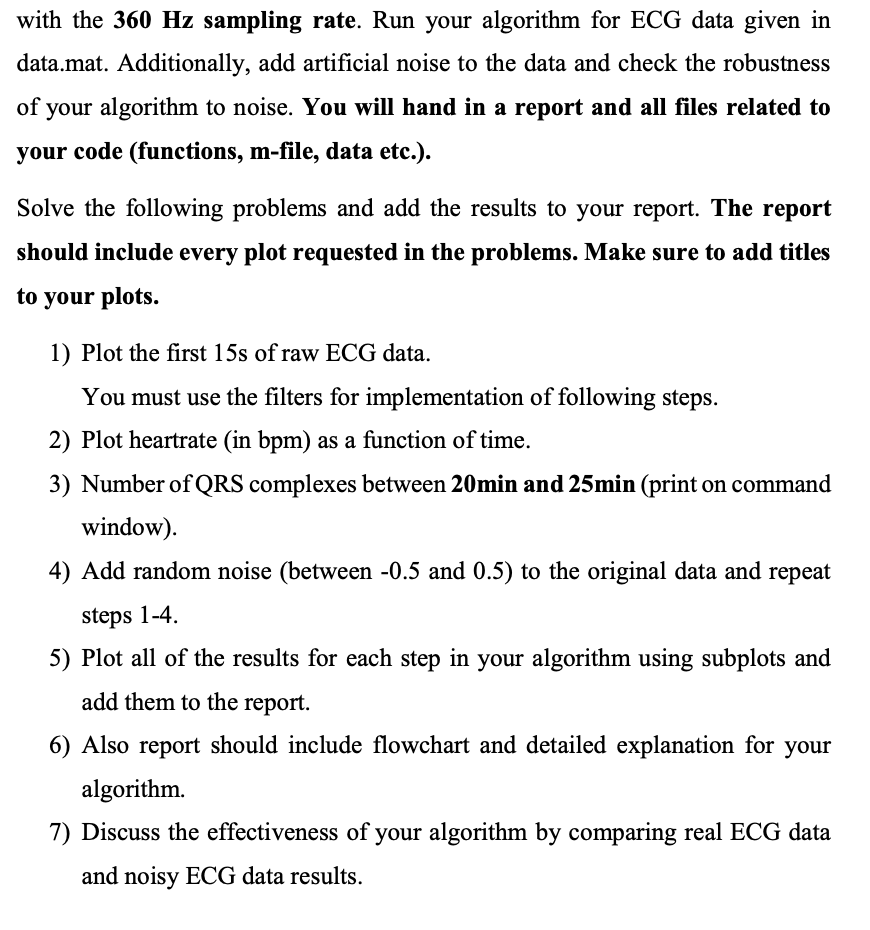
with the 3 6 0 H z sampling rate. Run your algorithm for ECG data given in data.mat. Additionally, add artificial noise to the data
with the sampling rate. Run your algorithm for ECG data given in
data.mat. Additionally, add artificial noise to the data and check the robustness
of your algorithm to noise. You will hand in a report and all files related to
your code functions mfile, data etc.
Solve the following problems and add the results to your report. The report
should include every plot requested in the problems. Make sure to add titles
to your plots.
Plot the first of raw ECG data.
You must use the filters for implementation of following steps.
Plot heartrate in bpm as a function of time.
Number of QRS complexes between min and min print on command
window
Add random noise between and to the original data and repeat
steps
Plot all of the results for each step in your algorithm using subplots and
add them to the report.
Also report should include flowchart and detailed explanation for your
algorithm.
Discuss the effectiveness of your algorithm by comparing real ECG data
and noisy ECG data results.
Step by Step Solution
There are 3 Steps involved in it
Step: 1

Get Instant Access to Expert-Tailored Solutions
See step-by-step solutions with expert insights and AI powered tools for academic success
Step: 2

Step: 3
Ace Your Homework with AI
Get the answers you need in no time with our AI-driven, step-by-step assistance
Get Started
Database Administrator Limited Edition
Authors: Martif Way
1st Edition
B0CGG89N8Z