Answered step by step
Verified Expert Solution
Question
1 Approved Answer
With the information, 1. Assess the total and per unit profitability of RFSs three loan products 2. Summarize the results of your analyses. Make specific

With the information,
1. Assess the total and per unit profitability of RFSs three loan products
2. Summarize the results of your analyses. Make specific recommendations to RFS to improve business profitability.
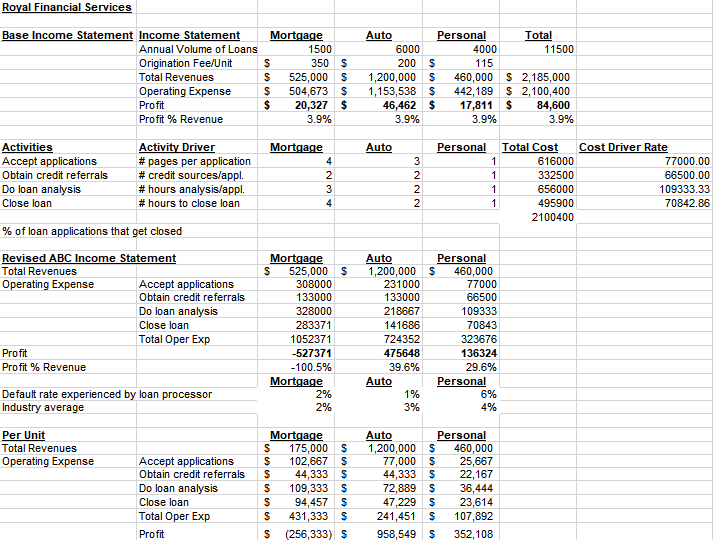
Royal Financial Services Base Income Statement Income Statement Annual Volume of Loans Origination Fee/Unit Total Revenues Operating Expense Profit Profit % Revenue Mortgage 1500 $ 350 S s 525,000 $ $ 504,673 $ $ 20,327 $ 3.9% Auto Personal Total 6000 4000 11500 200 $ 115 1,200,000 $ 460,000 S 2,185,000 1,153,538 $ 442,189 $ 2,100,400 46,462 $ 17,811 $ 84,600 3.9% 3.9% 3.9% Mortgage Auto Personal Activities Accept applications Obtain credit referrals Do loan analysis Close loan Activity Driver #pages per application # credit sources/appl. #hours analysis/appl. # hours to close loan 4 2 3 4 3 2 2 2 1 1 1 Total Cost Cost Driver Rate 616000 77000.00 332500 66500.00 656000 109333.33 495900 70842.86 2100400 1 % of loan applications that get closed Revised ABC Income Statement Total Revenues Operating Expense Accept applications Obtain credit referrals Do loan analysis Close loan Total Oper Exp Profit Profit % Revenue Mortgage $ 525,000 $ 308000 133000 328000 283371 1052371 -527371 -100.5% Mortgage 2% 2% Auto Personal 1,200,000 $ 460,000 231000 77000 133000 66500 218667 109333 141686 70843 724352 323676 475648 136324 39.6% 29.6% Auto Personal 1% 6% 3% 4% Default rate experienced by loan processor Industry average Per Unit Total Revenues Operating Expense Accept applications Obtain credit referrals Do loan analysis Close loan Total Oper Exp Profit Mortgage $ 175,000 $ S 102,667 $ S 44,333 S $ 109,333 5 $ 94,457 $ $ 431,333 $ $ (256,333) $ Auto Personal 1,200,000 $ 460,000 77,000 S 25,667 44,333 $ 22,167 72,889 $ 36,444 47,229 $ 23,614 241,451 $ 107,892 958,549 $ 352,108 Royal Financial Services Base Income Statement Income Statement Annual Volume of Loans Origination Fee/Unit Total Revenues Operating Expense Profit Profit % Revenue Mortgage 1500 $ 350 S s 525,000 $ $ 504,673 $ $ 20,327 $ 3.9% Auto Personal Total 6000 4000 11500 200 $ 115 1,200,000 $ 460,000 S 2,185,000 1,153,538 $ 442,189 $ 2,100,400 46,462 $ 17,811 $ 84,600 3.9% 3.9% 3.9% Mortgage Auto Personal Activities Accept applications Obtain credit referrals Do loan analysis Close loan Activity Driver #pages per application # credit sources/appl. #hours analysis/appl. # hours to close loan 4 2 3 4 3 2 2 2 1 1 1 Total Cost Cost Driver Rate 616000 77000.00 332500 66500.00 656000 109333.33 495900 70842.86 2100400 1 % of loan applications that get closed Revised ABC Income Statement Total Revenues Operating Expense Accept applications Obtain credit referrals Do loan analysis Close loan Total Oper Exp Profit Profit % Revenue Mortgage $ 525,000 $ 308000 133000 328000 283371 1052371 -527371 -100.5% Mortgage 2% 2% Auto Personal 1,200,000 $ 460,000 231000 77000 133000 66500 218667 109333 141686 70843 724352 323676 475648 136324 39.6% 29.6% Auto Personal 1% 6% 3% 4% Default rate experienced by loan processor Industry average Per Unit Total Revenues Operating Expense Accept applications Obtain credit referrals Do loan analysis Close loan Total Oper Exp Profit Mortgage $ 175,000 $ S 102,667 $ S 44,333 S $ 109,333 5 $ 94,457 $ $ 431,333 $ $ (256,333) $ Auto Personal 1,200,000 $ 460,000 77,000 S 25,667 44,333 $ 22,167 72,889 $ 36,444 47,229 $ 23,614 241,451 $ 107,892 958,549 $ 352,108Step by Step Solution
There are 3 Steps involved in it
Step: 1

Get Instant Access to Expert-Tailored Solutions
See step-by-step solutions with expert insights and AI powered tools for academic success
Step: 2

Step: 3

Ace Your Homework with AI
Get the answers you need in no time with our AI-driven, step-by-step assistance
Get Started


