

Question
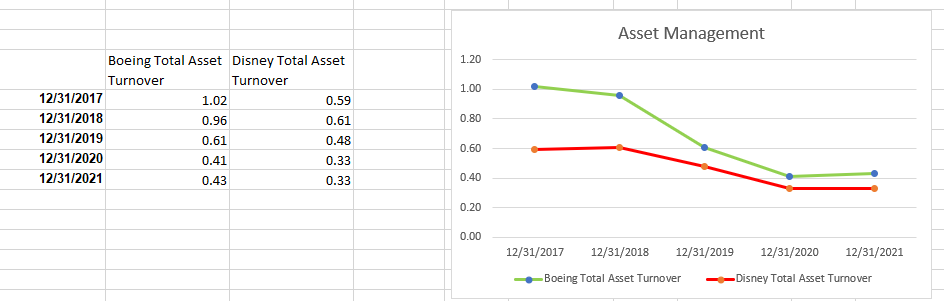
With the information from the Asset Management chart provided: Are there economic or end-market influences that explain why the ratios differ? What might they be?
With the information from the Asset Management chart provided:
Are there economic or end-market influences that explain why the ratios differ? What might they be?
Over time, is each companys overall financial performance improving, declining, or is something strange going on?
Would evaluating financial statements is a good idea? What do you regard as some of the shortcomings of financial ratio analysis?
Step by Step Solution
There are 3 Steps involved in it
Step: 1

Get Instant Access to Expert-Tailored Solutions
See step-by-step solutions with expert insights and AI powered tools for academic success
Step: 2

Step: 3
Ace Your Homework with AI
Get the answers you need in no time with our AI-driven, step-by-step assistance
Get Started
Bitcoin For Beginners Understanding And Expertise To Be Able To Swim Safely In The Bitcoin Pool
Authors: Suzanna Steuber
1st Edition
979-8354175697