

Answered step by step
Verified Expert Solution
Question
1 Approved Answer
. With the information generated from the following table derivate from the Bureau of Economic Analysis (https://apps.bea.gov/iTable/index_nipa.cfm), please do the regression analysis, with the
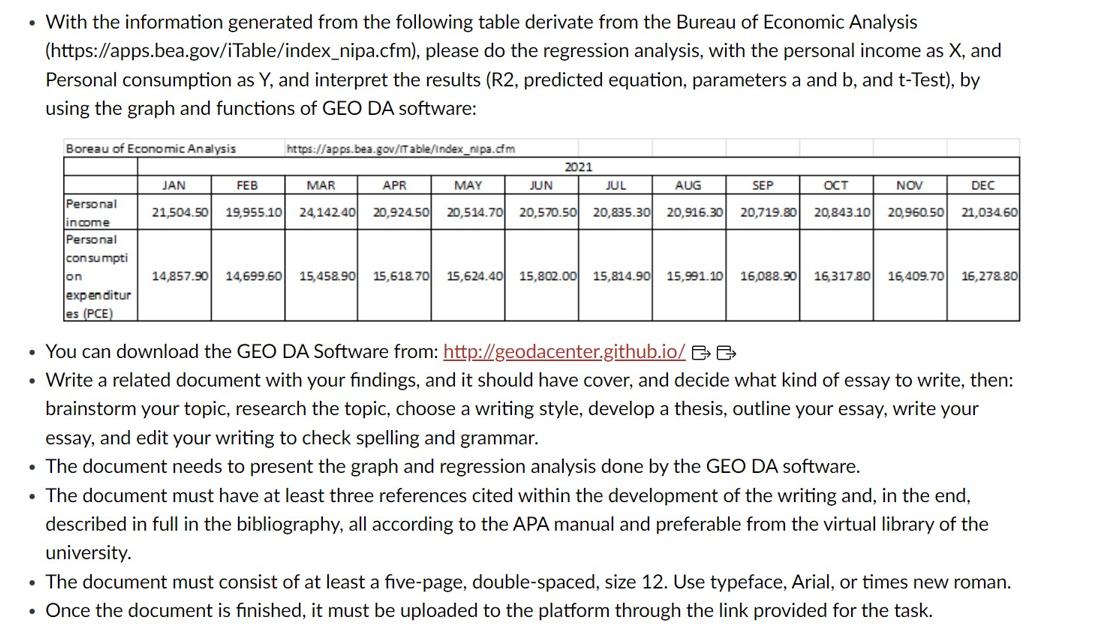
. With the information generated from the following table derivate from the Bureau of Economic Analysis (https://apps.bea.gov/iTable/index_nipa.cfm), please do the regression analysis, with the personal income as X, and Personal consumption as Y, and interpret the results (R2, predicted equation, parameters a and b, and t-Test), by using the graph and functions of GEO DA software: Boreau of Economic Analysis Personal income Personal consumpti on expenditur les (PCE) JAN https://apps.bea.gov/Table/index_nipa.cfm FEB APR JUL 21,504.50 19,955.10 24,14240 20,924.50 20,514.70 20,570.50 20,835.30 20,916.30 MAR MAY 2021 JUN AUG SEP OCT DEC NOV 20,719.80 20,843.10 20,960.50 21,034.60 14,857.90 14,699.60 15,458.90 15,618.70 15,624.40 15,802.00 15,814.90 15,991.10 16,088.90 16,317.80 16,409.70 16,278.80 You can download the GEO DA Software from: http://geodacenter.github.io/ Write a related document with your findings, and it should have cover, and decide what kind of essay to write, then: brainstorm your topic, research the topic, choose a writing style, develop a thesis, outline your essay, write your essay, and edit your writing to check spelling and grammar. The document needs to present the graph and regression analysis done by the GEO DA software. The document must have at least three references cited within the development of the writing and, in the end, described in full in the bibliography, all according to the APA manual and preferable from the virtual library of the university. The document must consist of at least a five-page, double-spaced, size 12. Use typeface, Arial, or times new roman. Once the document is finished, it must be uploaded to the platform through the link provided for the task.
Step by Step Solution
There are 3 Steps involved in it
Step: 1
Regression Analysis Report Using Geodata Software For the Bureau Of Economic Analysis Regression analysis is a statistical technique for determining t...
Get Instant Access to Expert-Tailored Solutions
See step-by-step solutions with expert insights and AI powered tools for academic success
Step: 2

Step: 3
Document Format ( 1 attachment)
6368b5d8b5097_107131.docx
120 KBs Word File
Ace Your Homework with AI
Get the answers you need in no time with our AI-driven, step-by-step assistance
Get Started
Business Statistics
Authors: Norean Sharpe, Richard Veaux, Paul Velleman
3rd Edition
978-0321944726, 321925831, 9780321944696, 321944720, 321944690, 978-0321925831