Question
With the Movement Control Order (MCO), the Malaysian population was confined to a long period of social isolation. The unprecedented rules had significantly altered the
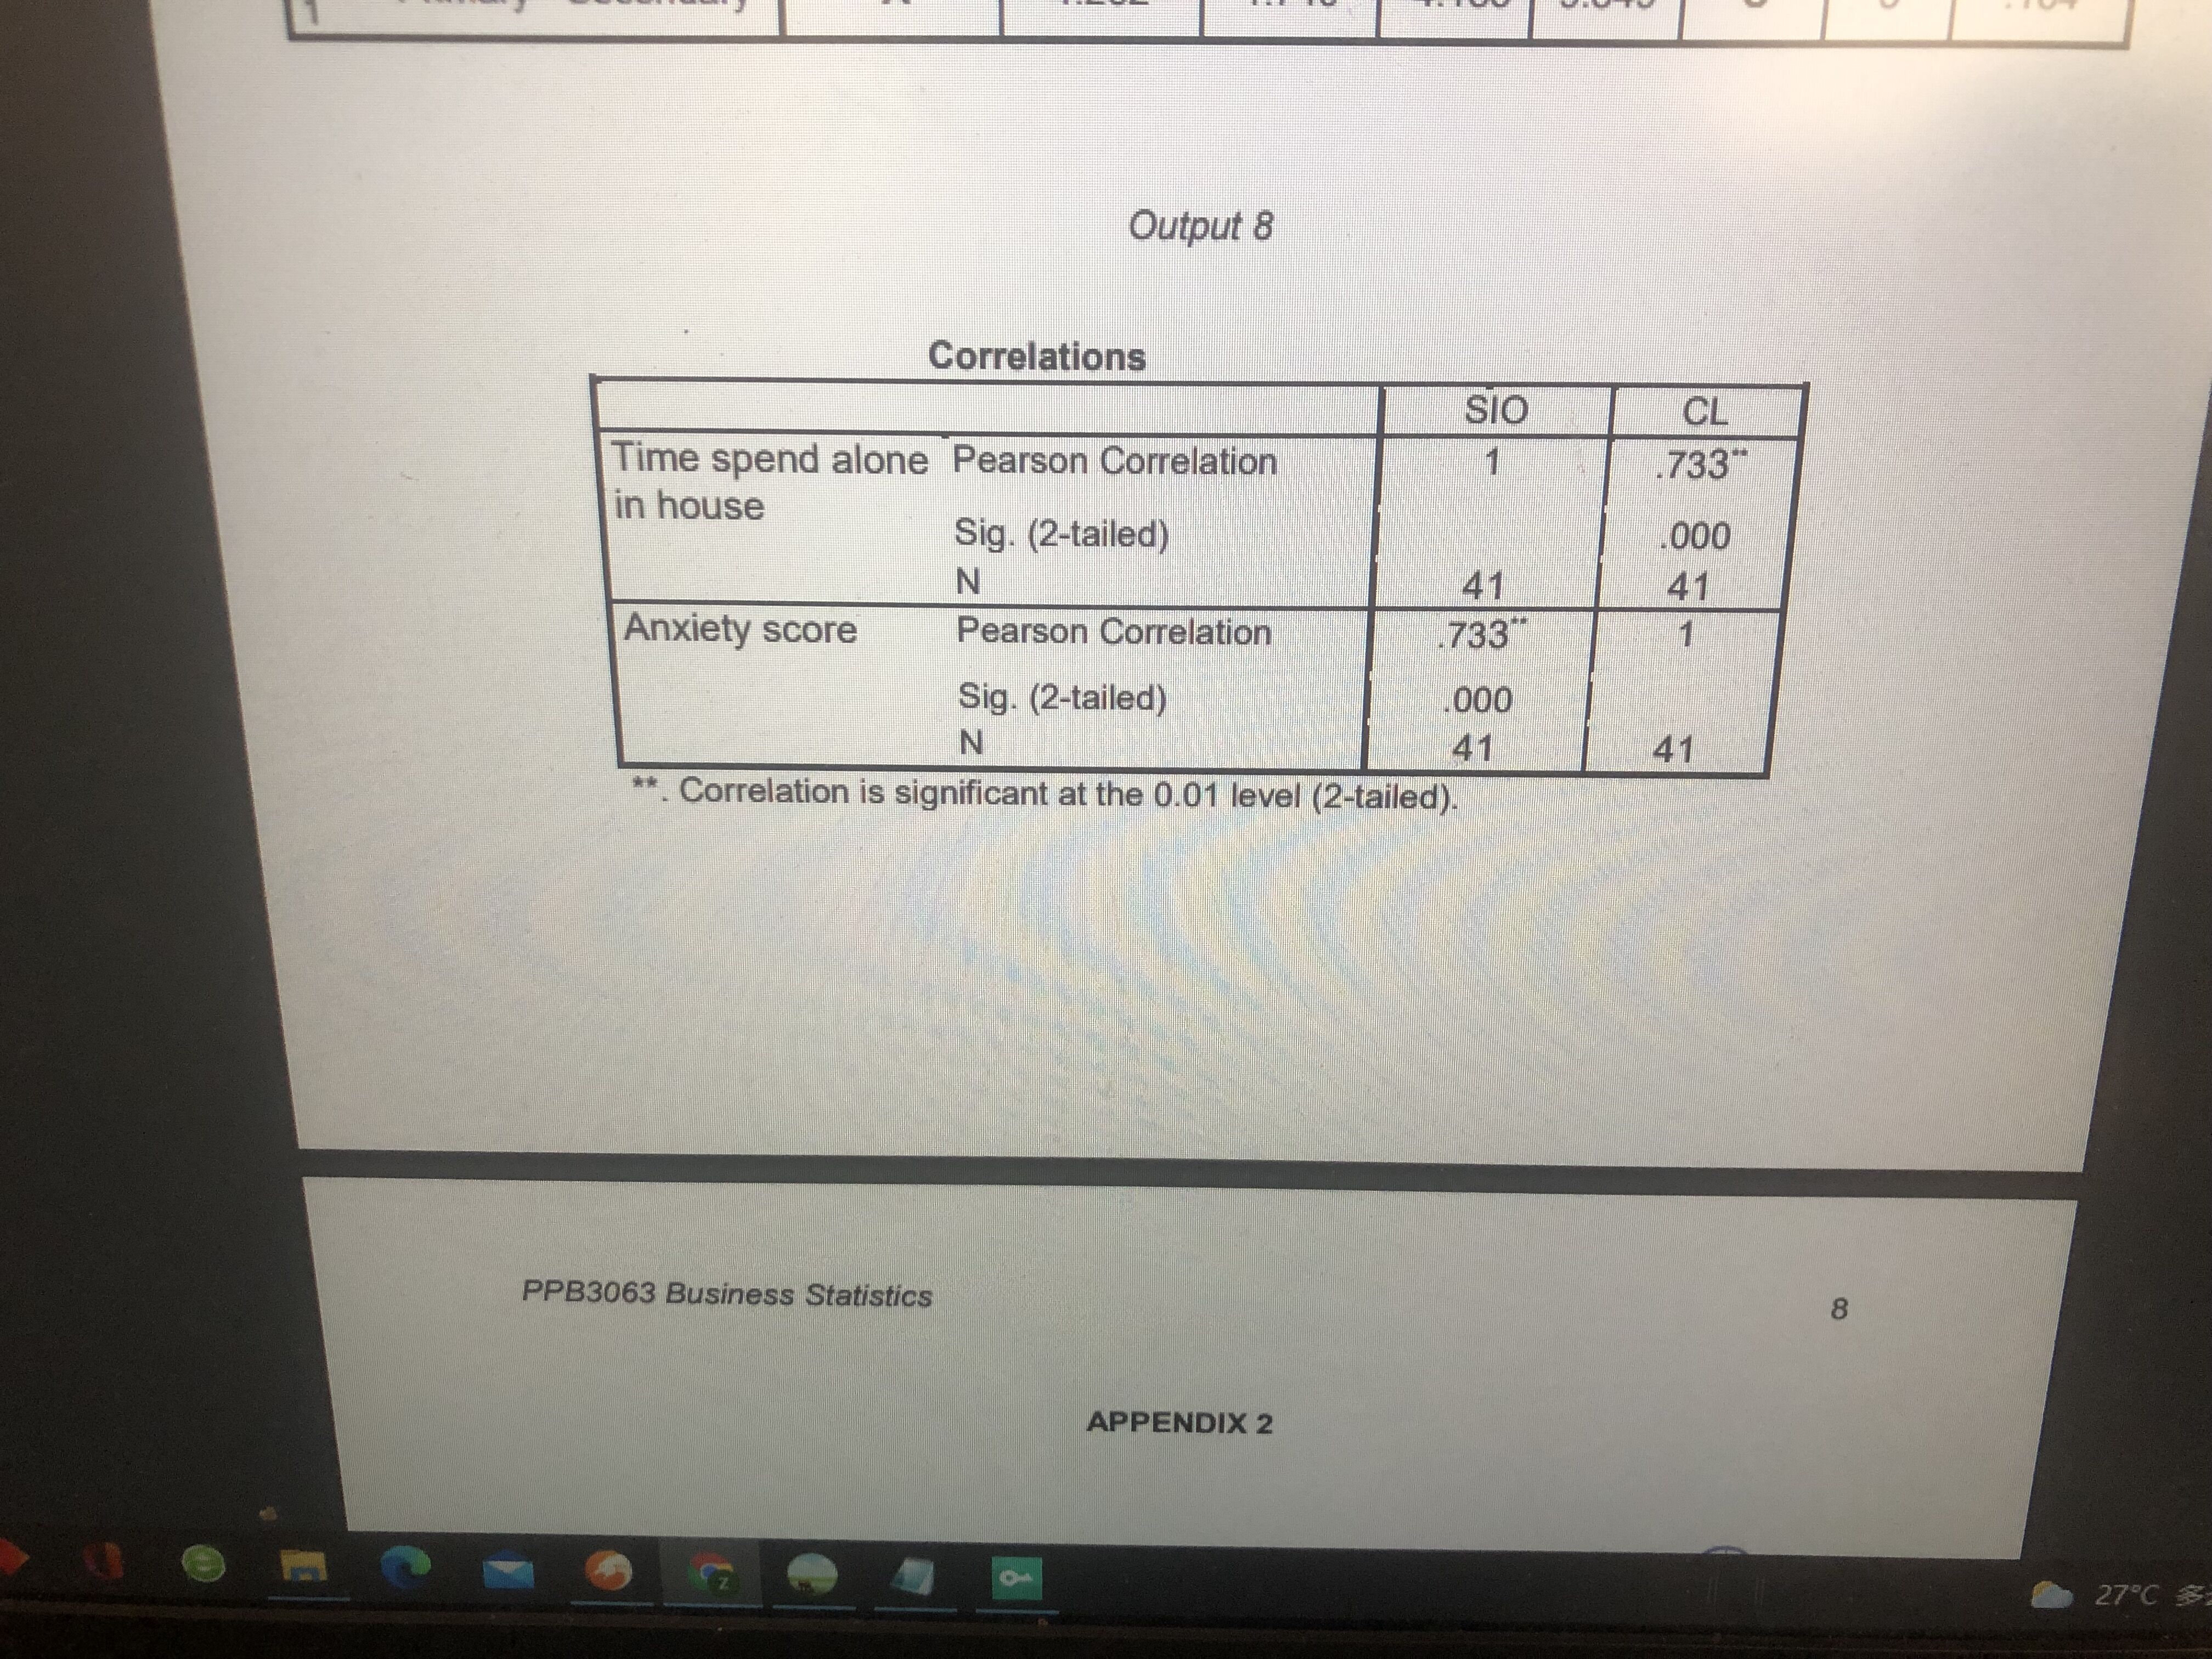
With the Movement Control Order (MCO), the Malaysian population was confined to a long period of social isolation. The unprecedented rules had significantly altered the lifestyles and social relationships between the people and had presumably developed deep levels of anxiety along with the fear of contracting the infection. Pearson correlation is used to understand whether there is an association between level of anxiety and time spent alone in the house during MCO (in hours). A total of 41 respondents were involved in the survey. The data gathered were analyzed by using SPSS software. Based on the above scenario and appropriate SPSS output,
a) sketch a scatter plot to illustrate the correlation between level of anxiety and hours spent alone during MCO.
b) when you choose to analyse your data using Pearson correlation, part of the process involves checking to make sure that the data you want to analyse can actually be analysed using Pearson's correlation. You need to do this because it is only appropriate to use Pearson's correlation if your data "passes" four assumptions that are required for Pearson's correlation to give you a valid result. List the four (4) assumptions.
c) write an appropriate hypothesis (null and alternative hypothesis).
d) using the 0.01 level of significance, what conclusion can you made on the correlation between level of anxiety and hours spent alone during MCO.


Step by Step Solution
There are 3 Steps involved in it
Step: 1

Get Instant Access to Expert-Tailored Solutions
See step-by-step solutions with expert insights and AI powered tools for academic success
Step: 2

Step: 3

Ace Your Homework with AI
Get the answers you need in no time with our AI-driven, step-by-step assistance
Get Started


