

Question
With this information that I got here, how do I comment the evolution of the cash cycle of the company, the reasons for which there
With this information that I got here, how do I comment the evolution of the cash cycle of the company, the reasons for which there is an increase of leverage of the company and the dividends distributed in 2017 and 2018.
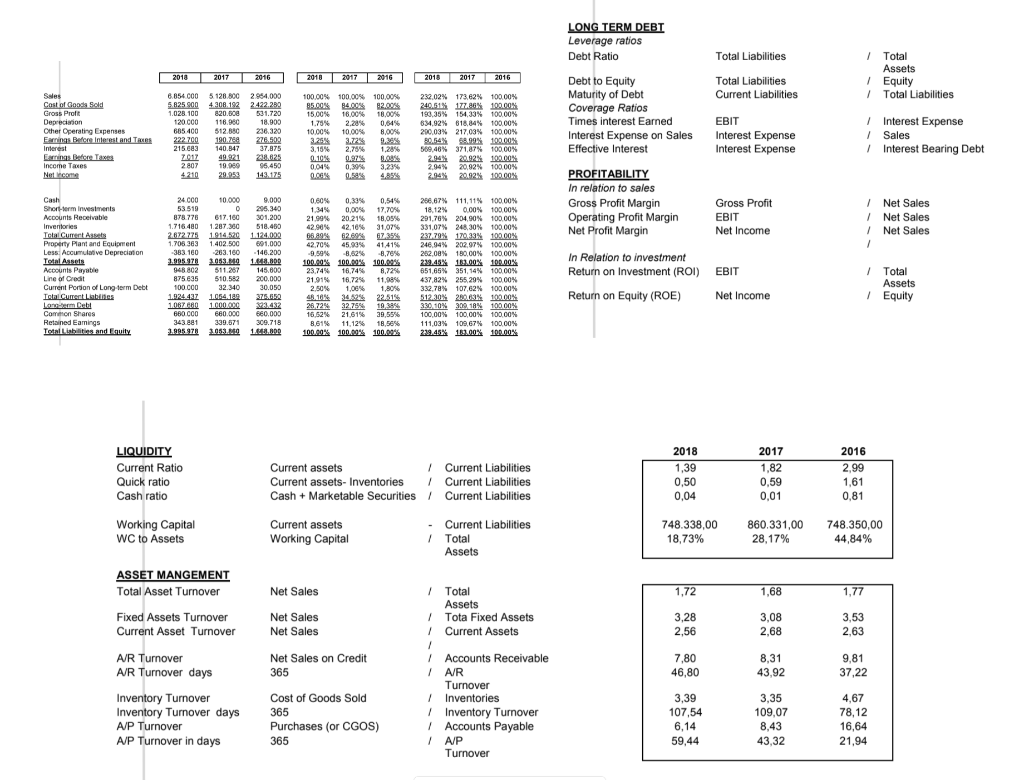
LONG TERM DEBI Leverage ratios Debt Ratio Total Liabilities 2018 2017 2016 2018 2017 2016 Total Liabilities Current Liabilities 1 Total Assets 1 Equity | Total Liabilities EBIT Sales Cast of Good Sold Gross Prof Deprecision Other Operating Expenses Earnings Before Interest and Texes Interest Earrings Before Taxes Income Taxes Net 6.854.000 5.128.500 5.8259004308.192 1.028.100 820.000 120.000 116.900 685 400 512.880 222700 190.7ea 215683 140.547 ZOAZ 49.821 2807 19.960 4210 29.952 2054,000 2.422.282 531.720 18.900 236.320 276.500 37.875 28.825 96.450 143175 100.00% 100.00% 100,00% 85.00% 84.00% 82.00% 15.00% 16.00% 18.00% 1.75% 2,28% 0.64% 10.00% 10.00% 8.00% 3.25% 3.77295 3.15% 2,704 1,28% 0.10% 097 0.044 0.394 3.23% 00% 2018 2017 2016 232,02% 173.62% 100.00% 240.51% 177.86 100.00% 190,35% 154,33% 100.00% % % 634,92% 618,84% 100,00% 200.03% 217.03% 100.00% 50.54% 58.99% 100.00 589,46% 371,87% 100.00% 2.94% 20.02% 100.00% 2.94% 20,92% 100.00% % % 2.94% 20.92% 100.00% Debt to Equity Maturity of Debt Coverage Ratios Times interest Earned Interest Expense on Sales Effective Interest PROFITABILITY In relation to sales Gross Profit Margin Operating Profit Margin Net Profit Margin 1 Interest Expense 1 Sales 1 Interest Bearing Debt Interest Expense Interest Expense 617.166 Gross Profit EBIT Net Income 1 Net Sales 1 Net Sales 1 Net Sales 1 Cash Short-term investments Accounts Receivable Inventories Totalcument Assets Property Plant and Equipment Less: Accumulative Depreciation Total Assets Accounts Payable Line of Credit Current Portion of Long-term Debt Total Current Labies Lonearm Call Common Shares Retained Earnings Total Liabilities and Equity 24 COO 10.000 53.510 0 878778 1.716 400 1.287.300 2.672 775 1914.20 1.706 363 1.402.500 383.160 263.100 3.995.978 2.053.100 948802 511.267 875e35 510.582 100 COO 32.340 1.924 432 1.054.128 1.067 en 1.000.ORG 680.000 660,000 343.881 339.571 3.883 9782053.00 9.000 296.340 301.200 518.450 1.124.00 591.000 -146.200 1.648.800 145.800 200.000 30.050 37.652 23.432 660.000 309.718 1.03.BOD 0.60% 0,30% 0.54% 1.34% 0.00% 17.70% 21.90% 20 21% 18,05% 42.90% 42,10% 31.07% 66.89% 62.694 6725% 42.70% 45.999 41.415 -9,59% -8.78% 100.00% 100.00% 100.00% 23.74% 16.74% 8.7296 21.91% 16.724 11,99% 2.50% 1,06% 1,80% 4. 346246 22251% 267296 32.76 10. 19 16.62% 21,61% 39,55% 8,61% 11,12% 18.56% 100.00% 100.00 100.00% 266.67% 111,11% 100.00% 18.12% 0.00% 0.00% 100.00% 291,76% 204,90% 100.00% 331,07% 248,30% 100.00% 237,79% 170,33% 100.00% 246.94% 202.97% 100.00% 262,08% 100,00% 100.00% 279.45% 10.00% 100.00% 651,65% 351,14% 100.00% 437,82% 255.29% 100.00% 332,78% 107,62% 100.00% 512.00% 20.03% 100.00% 330.10% 20% 100.00% 100,00% 100,00% 100.00% 111,03% 109,67% 100.00% 2:19.45% 101.00% 100.00% In Relation to investment Return on Investment (ROI) EBIT ) Return on Equity (ROE) Net Income 1 Total Assets | Equity LIQUIDITY Current Ratio Quick ratio Cash ratio 2018 1,39 0,50 0,04 2017 1,82 0,59 0,01 2016 2.99 1,61 0,81 Current assets 1 Current Liabilities Current assets - Inventories 1 Current Liabilities Cash + Marketable Securities / Current Liabilities Current assets - Current Liabilities Working Capital 1 Total Assets Working Capital WC to Assets 748.338,00 18,73% 860.331,00 28,17% 748.350,00 44,84% ASSET MANGEMENT Total Asset Turnover Net Sales 1,72 1,68 1,77 Fixed Assets Turnover Current Asset Turnover Net Sales Net Sales 3,28 2,56 3,08 2,68 3,53 2,63 A/R Turnover A/R Turnover days Net Sales on Credit 365 1 Total Assets / 1 Tota Fixed Assets 1 Current Assets / 1 Accounts Receivable I AIR Turnover 1 Inventories 1 Inventory Turnover 1 Accounts Payable A/P Turnover 7,80 46,80 8,31 43.92 9,81 37.22 Inventory Turnover Inventory Turnover days A/P Turnover AJP Turnover in days Cost of Goods Sold 365 Purchases (or CGOS) 365 3,39 107,54 6.14 59,44 3,35 109.07 8,43 43.32 4,67 78,12 16,64 21,94 LONG TERM DEBI Leverage ratios Debt Ratio Total Liabilities 2018 2017 2016 2018 2017 2016 Total Liabilities Current Liabilities 1 Total Assets 1 Equity | Total Liabilities EBIT Sales Cast of Good Sold Gross Prof Deprecision Other Operating Expenses Earnings Before Interest and Texes Interest Earrings Before Taxes Income Taxes Net 6.854.000 5.128.500 5.8259004308.192 1.028.100 820.000 120.000 116.900 685 400 512.880 222700 190.7ea 215683 140.547 ZOAZ 49.821 2807 19.960 4210 29.952 2054,000 2.422.282 531.720 18.900 236.320 276.500 37.875 28.825 96.450 143175 100.00% 100.00% 100,00% 85.00% 84.00% 82.00% 15.00% 16.00% 18.00% 1.75% 2,28% 0.64% 10.00% 10.00% 8.00% 3.25% 3.77295 3.15% 2,704 1,28% 0.10% 097 0.044 0.394 3.23% 00% 2018 2017 2016 232,02% 173.62% 100.00% 240.51% 177.86 100.00% 190,35% 154,33% 100.00% % % 634,92% 618,84% 100,00% 200.03% 217.03% 100.00% 50.54% 58.99% 100.00 589,46% 371,87% 100.00% 2.94% 20.02% 100.00% 2.94% 20,92% 100.00% % % 2.94% 20.92% 100.00% Debt to Equity Maturity of Debt Coverage Ratios Times interest Earned Interest Expense on Sales Effective Interest PROFITABILITY In relation to sales Gross Profit Margin Operating Profit Margin Net Profit Margin 1 Interest Expense 1 Sales 1 Interest Bearing Debt Interest Expense Interest Expense 617.166 Gross Profit EBIT Net Income 1 Net Sales 1 Net Sales 1 Net Sales 1 Cash Short-term investments Accounts Receivable Inventories Totalcument Assets Property Plant and Equipment Less: Accumulative Depreciation Total Assets Accounts Payable Line of Credit Current Portion of Long-term Debt Total Current Labies Lonearm Call Common Shares Retained Earnings Total Liabilities and Equity 24 COO 10.000 53.510 0 878778 1.716 400 1.287.300 2.672 775 1914.20 1.706 363 1.402.500 383.160 263.100 3.995.978 2.053.100 948802 511.267 875e35 510.582 100 COO 32.340 1.924 432 1.054.128 1.067 en 1.000.ORG 680.000 660,000 343.881 339.571 3.883 9782053.00 9.000 296.340 301.200 518.450 1.124.00 591.000 -146.200 1.648.800 145.800 200.000 30.050 37.652 23.432 660.000 309.718 1.03.BOD 0.60% 0,30% 0.54% 1.34% 0.00% 17.70% 21.90% 20 21% 18,05% 42.90% 42,10% 31.07% 66.89% 62.694 6725% 42.70% 45.999 41.415 -9,59% -8.78% 100.00% 100.00% 100.00% 23.74% 16.74% 8.7296 21.91% 16.724 11,99% 2.50% 1,06% 1,80% 4. 346246 22251% 267296 32.76 10. 19 16.62% 21,61% 39,55% 8,61% 11,12% 18.56% 100.00% 100.00 100.00% 266.67% 111,11% 100.00% 18.12% 0.00% 0.00% 100.00% 291,76% 204,90% 100.00% 331,07% 248,30% 100.00% 237,79% 170,33% 100.00% 246.94% 202.97% 100.00% 262,08% 100,00% 100.00% 279.45% 10.00% 100.00% 651,65% 351,14% 100.00% 437,82% 255.29% 100.00% 332,78% 107,62% 100.00% 512.00% 20.03% 100.00% 330.10% 20% 100.00% 100,00% 100,00% 100.00% 111,03% 109,67% 100.00% 2:19.45% 101.00% 100.00% In Relation to investment Return on Investment (ROI) EBIT ) Return on Equity (ROE) Net Income 1 Total Assets | Equity LIQUIDITY Current Ratio Quick ratio Cash ratio 2018 1,39 0,50 0,04 2017 1,82 0,59 0,01 2016 2.99 1,61 0,81 Current assets 1 Current Liabilities Current assets - Inventories 1 Current Liabilities Cash + Marketable Securities / Current Liabilities Current assets - Current Liabilities Working Capital 1 Total Assets Working Capital WC to Assets 748.338,00 18,73% 860.331,00 28,17% 748.350,00 44,84% ASSET MANGEMENT Total Asset Turnover Net Sales 1,72 1,68 1,77 Fixed Assets Turnover Current Asset Turnover Net Sales Net Sales 3,28 2,56 3,08 2,68 3,53 2,63 A/R Turnover A/R Turnover days Net Sales on Credit 365 1 Total Assets / 1 Tota Fixed Assets 1 Current Assets / 1 Accounts Receivable I AIR Turnover 1 Inventories 1 Inventory Turnover 1 Accounts Payable A/P Turnover 7,80 46,80 8,31 43.92 9,81 37.22 Inventory Turnover Inventory Turnover days A/P Turnover AJP Turnover in days Cost of Goods Sold 365 Purchases (or CGOS) 365 3,39 107,54 6.14 59,44 3,35 109.07 8,43 43.32 4,67 78,12 16,64 21,94Step by Step Solution
There are 3 Steps involved in it
Step: 1

Get Instant Access to Expert-Tailored Solutions
See step-by-step solutions with expert insights and AI powered tools for academic success
Step: 2

Step: 3
Ace Your Homework with AI
Get the answers you need in no time with our AI-driven, step-by-step assistance
Get Started
Intermediate Accounting
Authors: James D. Stice, Earl K. Stice, Fred Skousen
16th Edition
324376375, 0324375743I, 978-0324376371, 9780324375749, 978-0324312140