Answered step by step
Verified Expert Solution
Link Copied!

Question

1 Approved Answer

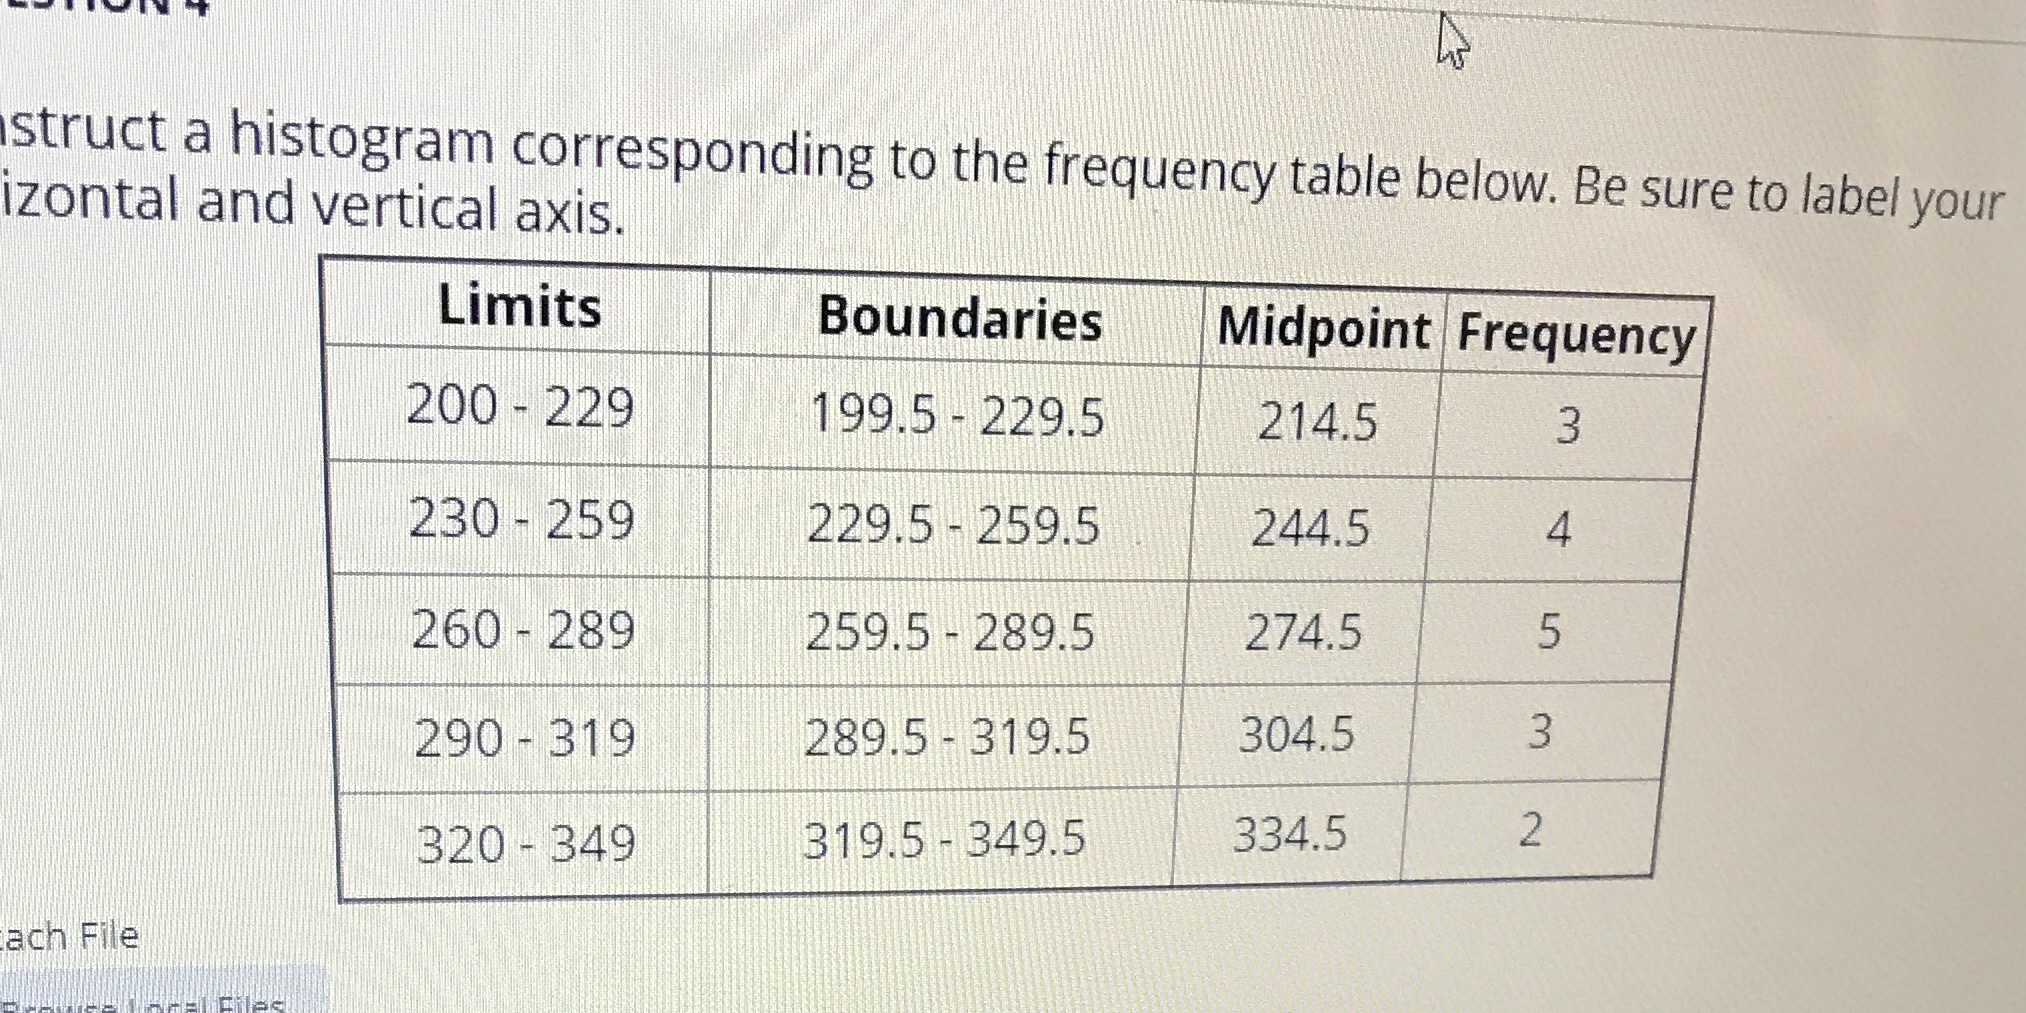
With what do we create the histogram? Frequently and boundaries? struct a histogram corresponding to the frequency table below. Be sure to label your izontal

With what do we create the histogram? Frequently and boundaries?

image text in transcribed
struct a histogram corresponding to the frequency table below. Be sure to label your izontal and vertical axis. Limits Boundaries Midpoint Frequency 200 - 229 199.5 - 229.5 214.5 230 - 259 229.5 - 259.5 244.5 4 260 - 289 259.5 - 289.5 274.5 5 290 - 319 289.5 - 319.5 304.5 3 319.5 - 349.5 334.5 2 320 - 349 ach File

Step by Step Solution

There are 3 Steps involved in it

Step: 1

blur-text-image

Get Instant Access to Expert-Tailored Solutions

See step-by-step solutions with expert insights and AI powered tools for academic success

Step: 2

blur-text-image

Step: 3

blur-text-image

Ace Your Homework with AI

Get the answers you need in no time with our AI-driven, step-by-step assistance

Get Started

Recommended Textbook for

Applied Calculus

Authors: Stefan Waner, Steven Costenoble

6th Edition

1285415310, 9781285415314

More Books

Students also viewed these Mathematics questions

Question

3. Contrast relational contexts in organizations

Answered: 1 week ago

Question

2. Describe ways in which organizational culture is communicated

Answered: 1 week ago

Question

1. Describe and compare approaches to managing an organization

Answered: 1 week ago