

Answered step by step
Verified Expert Solution
Question
1 Approved Answer
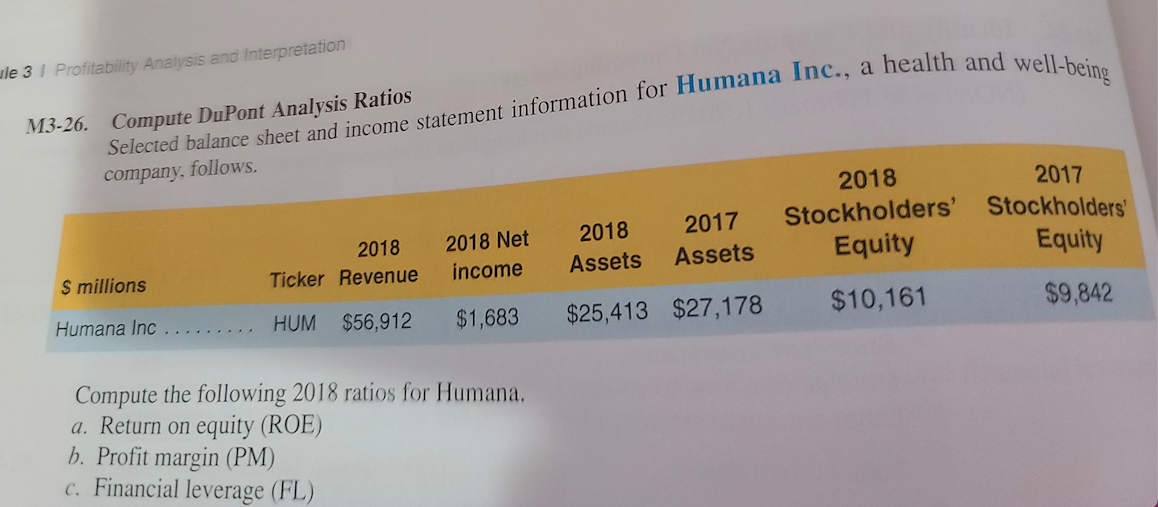
wle 3 Profitability Analysis and interpretation M3-26. Compute DuPont Analysis Ratios Selected balance sheet and income statement information for Humana Inc., a health and well-being
Step by Step Solution
There are 3 Steps involved in it
Step: 1

Get Instant Access to Expert-Tailored Solutions
See step-by-step solutions with expert insights and AI powered tools for academic success
Step: 2

Step: 3
Ace Your Homework with AI
Get the answers you need in no time with our AI-driven, step-by-step assistance
Get Started
Public Finance A Contemporary Application Of Theory To Policy
Authors: David N Hyman
12th Edition
0357442156, 978-0357442159