

Answered step by step
Verified Expert Solution
Question
1 Approved Answer
Wondering how to find a) The net present value b)The expected net present value and c) How to determine based on the chart which option
 Wondering how to find a) The net present value
b)The expected net present value and c) How to determine based on the chart which option would be the most economically efficient choice?
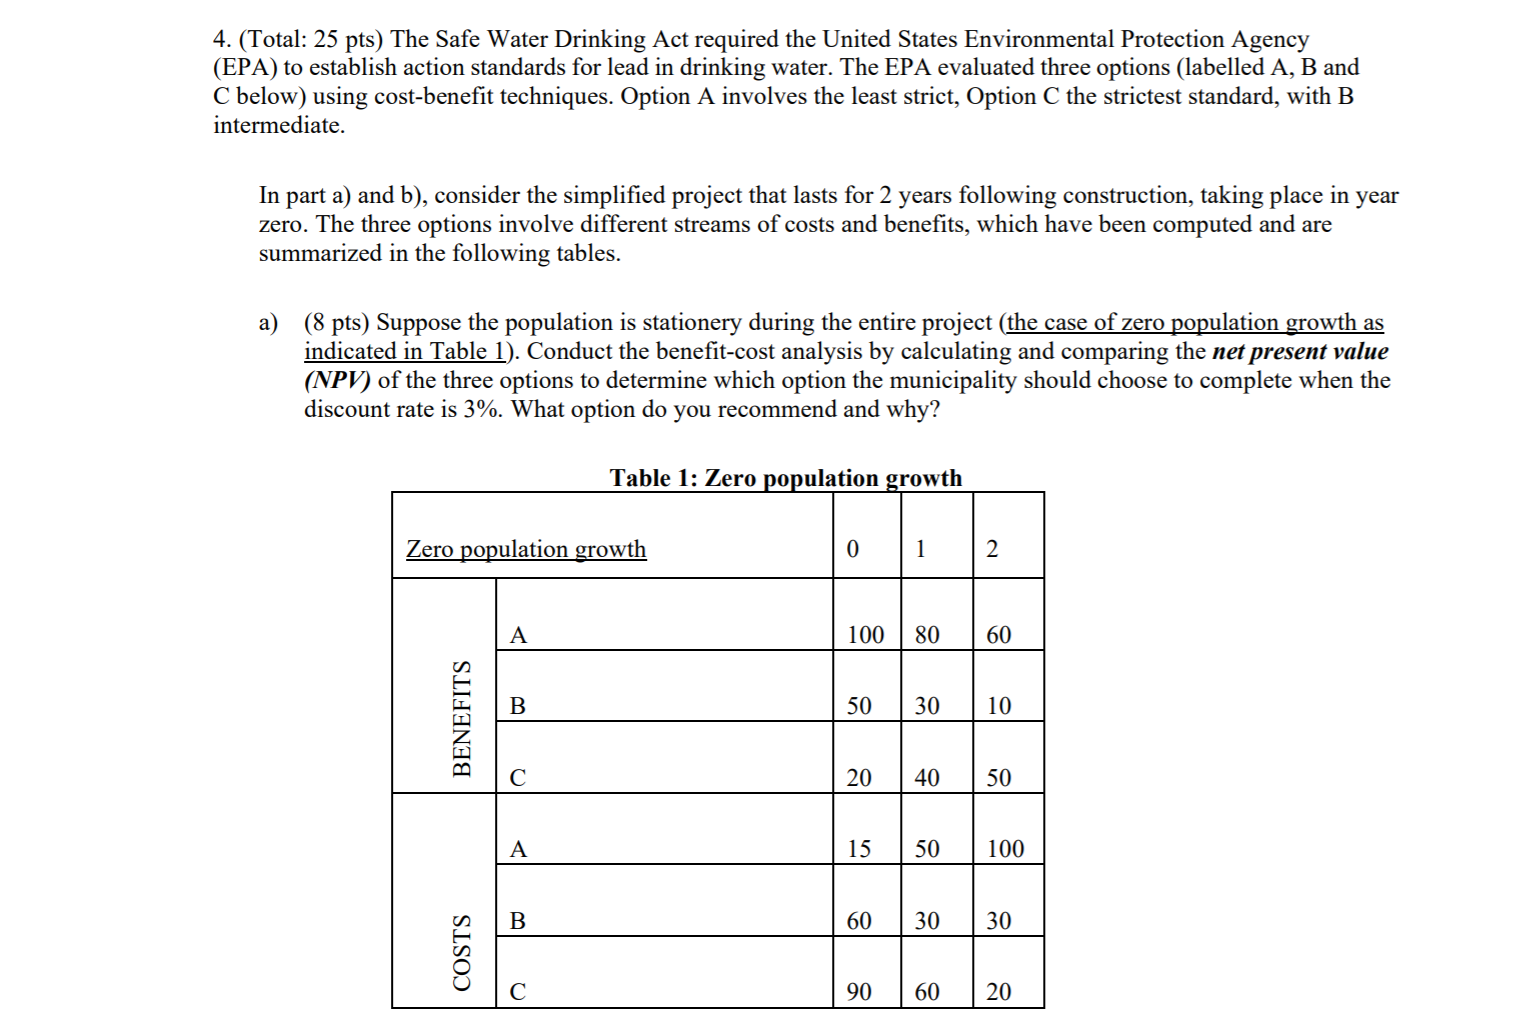
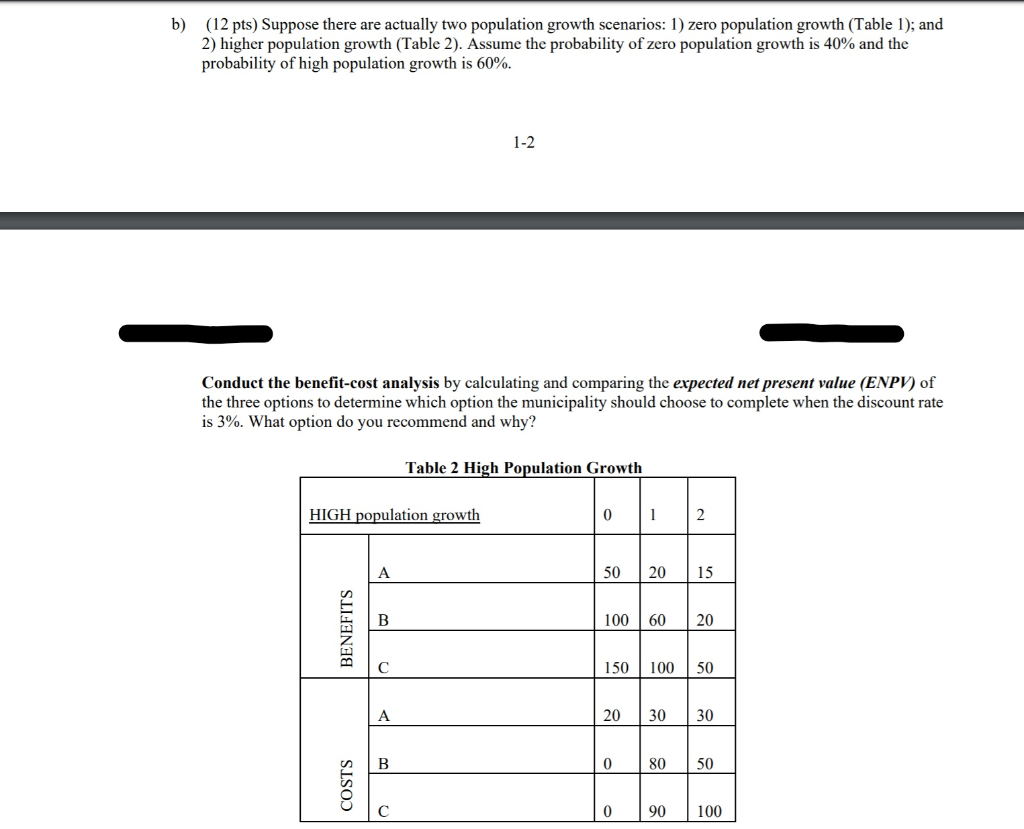
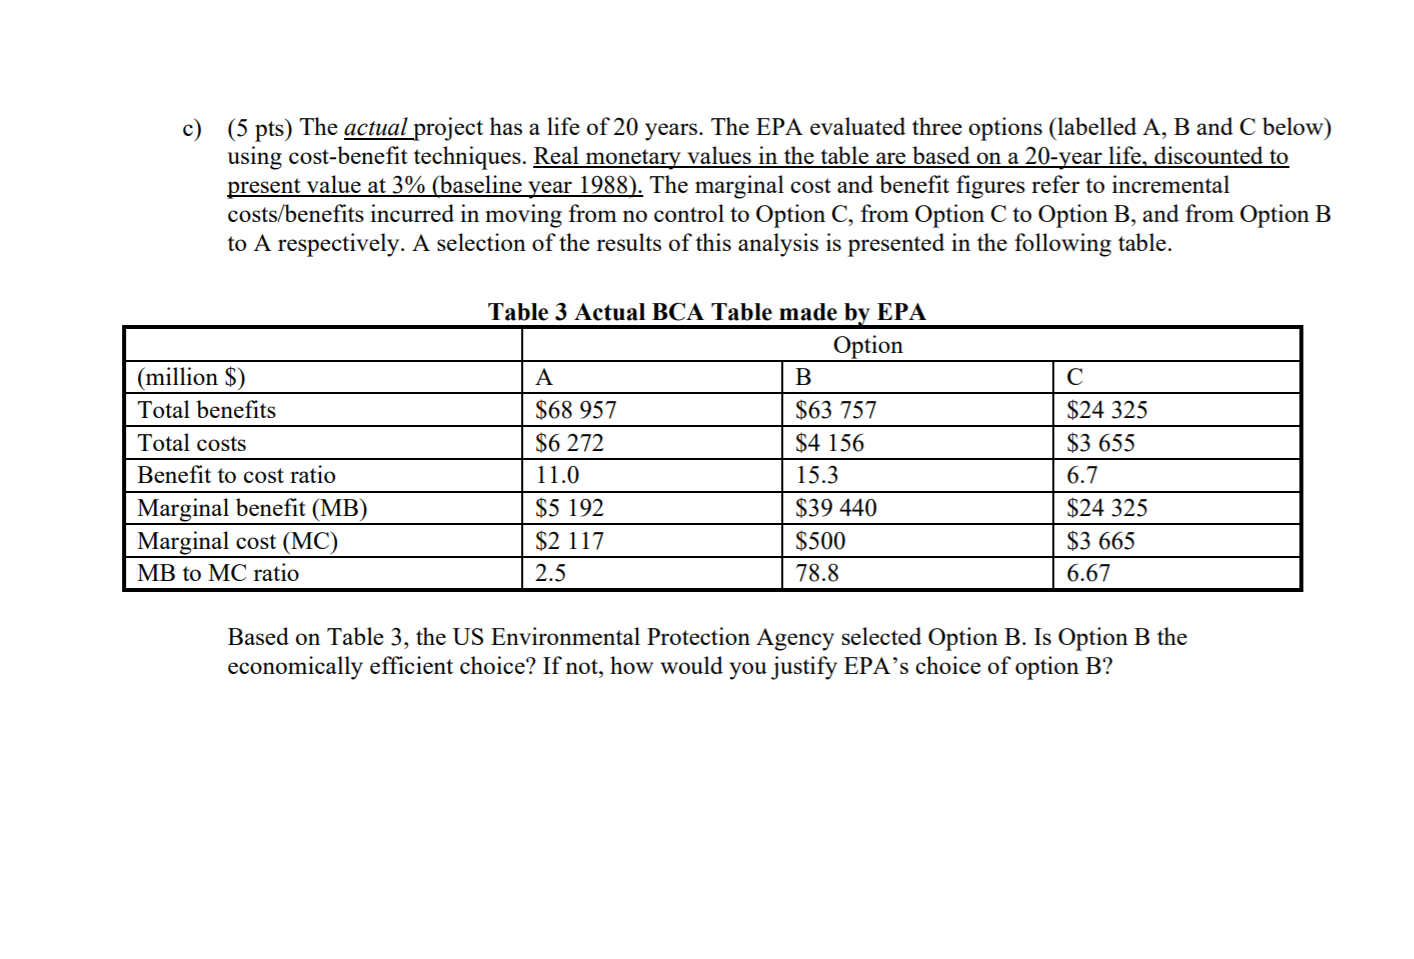
4. (Total: 25 pts) The Safe Water Drinking Act required the United States Environmental Protection Agency (EPA) to establish action standards for lead in drinking water. The EPA evaluated three options (labelled A, B and C below) using cost-benefit techniques. Option A involves the least strict, Option C the strictest standard, with B intermediate. In part a) and b), consider the simplified project that lasts for 2 years following construction, taking place in year zero. The three options involve different streams of costs and benefits, which have been computed and are summarized in the following tables. ) (8 pts) Suppose the population is stationery during the entire project (the case of zero population growth as indicated in Table 1). Conduct the benefit-cost analysis by calculating and comparing the net present value (NPV) of the three options to determine which option the municipality should choose to complete when the discount rate is 3%. What option do you recommend and why? Table 1: Zero population growth Zero population growth 100 80 60 BENEFITS | 100 o COSTS 90 60 20 b) (12 pts) Suppose there are actually two population growth scenarios: 1) zero population growth (Table 1); and 2) higher population growth (Table 2). Assume the probability of zero population growth is 40% and the probability of high population growth is 60%. 1-2 Conduct the benefit-cost analysis by calculating and comparing the expected net present value (ENPV) of the three options to determine which option the municipality should choose to complete when the discount rate is 3%. What option do you recommend and why? Table 2 High Population Growth HIGH population growth 2015 100 60 20 BENEFITS 150 100 50 80 50 COSTS | 90 100 c) (5 pts) The actual project has a life of 20 years. The EPA evaluated three options (labelled A, B and C below) using cost-benefit techniques. Real monetary values in the table are based on a 20-year life, discounted to present value at 3% (baseline year 1988). The marginal cost and benefit figures refer to incremental costs/benefits incurred in moving from no control to Option C, from Option C to Option B, and from Option B to A respectively. A selection of the results of this analysis is presented in the following table. B (million $) Total benefits Total costs Benefit to cost ratio Marginal benefit (MB) Marginal cost (MC) MB to MC ratio Table 3 Actual BCA Table made by EPA Option LA $68 957 $63 757 $6 272 $4 156 11.0 | 15.3 $5 192 $39 440 $2 117 $500 2.5 | 78.8 DO 212 $24 325 $3 655 6.7 $24 325 $3 665 6.67 Based on Table 3, the US Environmental Protection Agency selected Option B. Is Option B the economically efficient choice? If not, how would you justify EPA's choice of option B? 4. (Total: 25 pts) The Safe Water Drinking Act required the United States Environmental Protection Agency (EPA) to establish action standards for lead in drinking water. The EPA evaluated three options (labelled A, B and C below) using cost-benefit techniques. Option A involves the least strict, Option C the strictest standard, with B intermediate. In part a) and b), consider the simplified project that lasts for 2 years following construction, taking place in year zero. The three options involve different streams of costs and benefits, which have been computed and are summarized in the following tables. ) (8 pts) Suppose the population is stationery during the entire project (the case of zero population growth as indicated in Table 1). Conduct the benefit-cost analysis by calculating and comparing the net present value (NPV) of the three options to determine which option the municipality should choose to complete when the discount rate is 3%. What option do you recommend and why? Table 1: Zero population growth Zero population growth 100 80 60 BENEFITS | 100 o COSTS 90 60 20 b) (12 pts) Suppose there are actually two population growth scenarios: 1) zero population growth (Table 1); and 2) higher population growth (Table 2). Assume the probability of zero population growth is 40% and the probability of high population growth is 60%. 1-2 Conduct the benefit-cost analysis by calculating and comparing the expected net present value (ENPV) of the three options to determine which option the municipality should choose to complete when the discount rate is 3%. What option do you recommend and why? Table 2 High Population Growth HIGH population growth 2015 100 60 20 BENEFITS 150 100 50 80 50 COSTS | 90 100 c) (5 pts) The actual project has a life of 20 years. The EPA evaluated three options (labelled A, B and C below) using cost-benefit techniques. Real monetary values in the table are based on a 20-year life, discounted to present value at 3% (baseline year 1988). The marginal cost and benefit figures refer to incremental costs/benefits incurred in moving from no control to Option C, from Option C to Option B, and from Option B to A respectively. A selection of the results of this analysis is presented in the following table. B (million $) Total benefits Total costs Benefit to cost ratio Marginal benefit (MB) Marginal cost (MC) MB to MC ratio Table 3 Actual BCA Table made by EPA Option LA $68 957 $63 757 $6 272 $4 156 11.0 | 15.3 $5 192 $39 440 $2 117 $500 2.5 | 78.8 DO 212 $24 325 $3 655 6.7 $24 325 $3 665 6.67 Based on Table 3, the US Environmental Protection Agency selected Option B. Is Option B the economically efficient choice? If not, how would you justify EPA's choice of option BStep by Step Solution
There are 3 Steps involved in it
Step: 1

Get Instant Access to Expert-Tailored Solutions
See step-by-step solutions with expert insights and AI powered tools for academic success
Step: 2

Step: 3
Ace Your Homework with AI
Get the answers you need in no time with our AI-driven, step-by-step assistance
Get Started
Financial Markets And Institutions
Authors: Anthony Saunders, Marcia Cornett
7th Edition
1259919714, 978-1259919718